

Whenever the name William D. Gann is mentioned people usually think of a poorly explained complex method or something to do with astrology. But, there are a few easy trading methods which Gann taught. Here is one using Gann trend lines.
STRATEGY BACKGROUND
These trend lines indicate uptrend/downtrend, either the minor or the main trend. For a market whose trend is up we use a green trend line. An uptrend is defined as higher tops and a higher bottom.
The first bar that scores a higher bottom and a higher top than the previous bar signals a shift. The green trend line is moved up to the top of that bar. As long as the stock makes higher bottoms and higher tops, the green trend line continues to be moved up to the high point of each bar.
The reverse of that is the red trend line which is used when the trend is turned fromup to down. Downtrend here is defined as lower tops and lower bottoms. The red trend line means that the minor or the main trend has turned down and the emphasis of this method is to follow the trend line until it reverses.
GETTING IN
It’s simple. Buy when the red trend line changes to green. Sell when the green trend line changes to red.
ENTRY AND EXIT POINTS
Type 1 Trade – A buy can be taken near the old bottom or a sell can be taken near the old top. This strategy has a higher risk so a small stop-loss should be utilized as trend sometimes continue without stopping at supports or resistance.
Type 2 Trade – A buy or sell can be taken when a stock crosses former tops or crosses a series of tops/bottoms of previous bars, showing that the minor or the main trend has turned up as indicated by the green trend line or has turned down as indicated by the red trend line, this strategy has a lower risk as compared to the earlier one.
Type 3 Trade – Buy/sell on a secondary reaction after a stock has crossed previous tops/bottoms and the advance/decline exceeds the greatest rally/decline on the way down from the top. Buy when the first rally from the extreme bottom exceeds in time the greatest rally in the preceding bear campaign and this becomes opposite for a short trade.
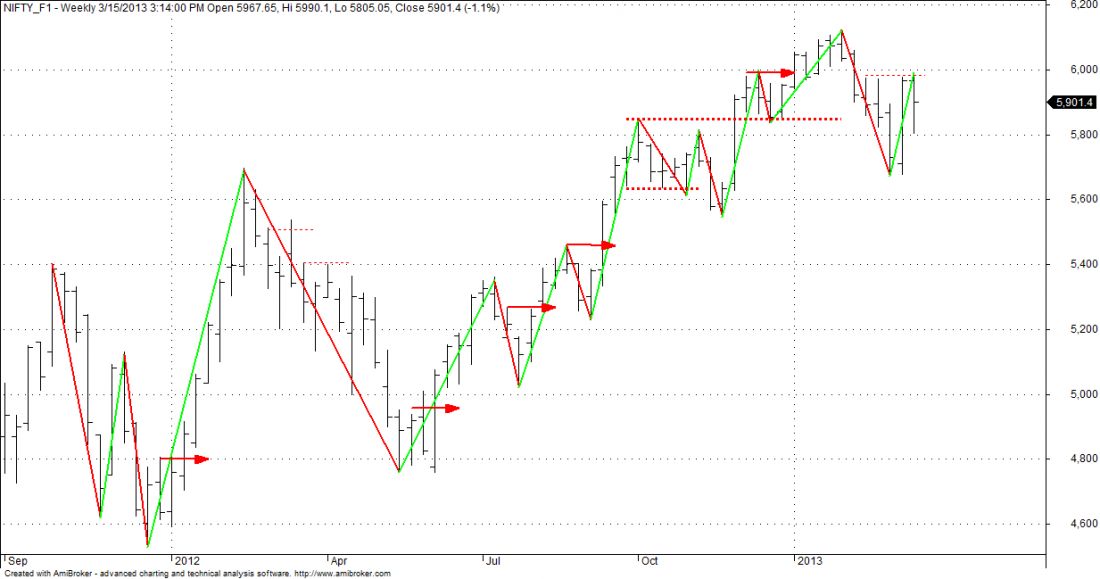
Chart Caption
This chart shows the Nifty-Futures contract plotted on a weekly time frame showing trend lines connecting tops and bottoms up to the reversal. Green trend line shows uptrend and red trend lines shows downtrend. Dotted lines in April 2012 show breakouts which were not initiated, arrows show trade above previous bars or series of previous bars (Type 2 Trade) and the thick dotted lines are buys near the earlier top (Type 1 Trade).The current structure is an uptrend but the Type 2 trade is not initiated yet (Dotted line showing resistance at earlier bar highs).

