

China’s debt levels out of control?
China is amassing debt at record levels and it signals the potential for another major financial crisis in the horizon. Since June of last year, more than 10 provinces and cities in China have loaded up on fresh stimulus plans that total up to 20 trillion Yuan ($3.3 trillion), according to a recent report by the Chinese newspaper First Financial Daily. China’s doubling its debt levels to $3.3 trillion at the end of 2012 is a very disturbing sign.
“China has the highest investment-to-gross domestic product ratio in the world — a downturn in its investment cycle would not only adversely affect its economy but also those of others, and global commodities prices,” Standard & Poor’s said in a February report.
Japan’s default is imminent.
In a recent report Michael Pento made the following observations:
“The Japanese Finance Ministry recently predicted that debt service payments would reach $257 billion (25.3 trillion Yen) during this fiscal year; up 13.7% from fiscal 2013. Also, revenue for this year is projected to be 45.4 trillion Yen. This means interest expenses as a percentage of total government revenue will reach 56%. Therefore, it should now be abundantly clear to all holders of JGBs that since over half of all national income must soon go to pay interest on the debt, the chances of the principal being repaid in anything close to real terms is zero. A massive default in explicit or implicit terms on the quadrillion yen ($10 trillion), which amounts to 242% of gross domestic product, is now assured to happen shortly.”
Part of the problem is Japan’s obsession with the idea that creating more inflation could be the solution. “Central Bank Governor Kuroda said recently that the inflation goal of 2% is well on track to be realized. Core inflation is already up 1.3%, and overall prices have climbed 1.6%, while fresh food prices have surged 13.6% from the year ago period. In fact, Japanese inflation is now at a five-year high,” he stated.
The current tapering policies by the U.S. Federals Reserve bank in regards its own bond buying purchases, are sending a mixed signal to the financial community. How can the Fed’s maintain a zero base interest rate policy for much longer while they are once again manipulating short term interest rates higher?
The idea of stimulating the velocity of money back into the system by forcing short term rates higher is very dangerous for the stability of the global financial markets. If it gets out of control it could rapidly ignite suppressed levels of inflation and possibly hyperinflation exacerbating an already sluggish and fragile economy. These are the results of monetary policies the Fed’s have implemented for the U.S. economy since the great recession of 2008 in order to stimulate economic growth. But the data points to the contrary. The U.S. balance sheet is out of control from $800 billion in 2008 to more than $4 trillion currently and growing with no end in sight.
In a recent interview I asked Eric Sprott, Chairman, chief executive officer & Portfolio Manager of Sprott Asset Management Group the following question:
“Is the long end of the bond market (30 year) under pressure for higher rates or is it just in the short end of the yield curve?” And he said:
“It’s not going to handle it well because literally the Fed is buying the biggest part of all those long issues and if they step away from the market then obviously the rates will go higher and we’ve already seen many countries, most notably China, saying we have no interest in increasing our foreign exchange reserves, i.e. buying foreign paper. As you know the Chinese essentially have stepped out of the U.S. market when they use to buy a huge percent of all bond issues and therefore I think the Fed had to come in and buy the bonds the minute that China stepped away from the market. So if they decrease their buying it’s highly likely we’ll see much higher interest rates here.”
In a recently published interview I asked Dr. Marc Faber PhD the following:
“Is the US economy strong enough to require such a change in monetary policy?”
“I mean basically we have the same things since November 2008 when QE was introduced the first time. At that time they were talking about an exit strategy. You will never hear about an exit strategy today. They talk about maybe tapering. When they started in 2008, my argument was, believe me we are going to go to QE 99. We are never going to stop the program because when governments introduce new programs under the excuse of urgency to fix something usually these programs stay in place for a very long time. And all this talk about tapering, maybe they’ll do a kind of cosmetic tapering at some point, like actually I have to say as of today this year alone, the Fed’s have bought more than $1 tn worth of treasuries and mortgage backed securities because they not only have this $85 bn of asset programs but they also have the accruing interest to invest. So they bought much more than they have made public. Now, can they go down from a purchase of $85 bn?… Yes, it’s going to be cosmetic. As soon as the economy weakens again, as soon as there is an economic crisis, they will go to $150 bn a month or more,” he commented.
Has Silver Bottomed?
It appears the gold and silver markets have fulfilled the secondary corrective pattern objectives with the low of 19.58 for silver and 1286 for gold established on Thursday March 27. The secondary cyclical bottom came in as expected during the 28/31 March time frame. Once this bottom unfolds, the next wave up in silver should take us into the 26 to 27 region over the next 3 months. This pattern projects an intermediate uptrend into the late May early June time frame.
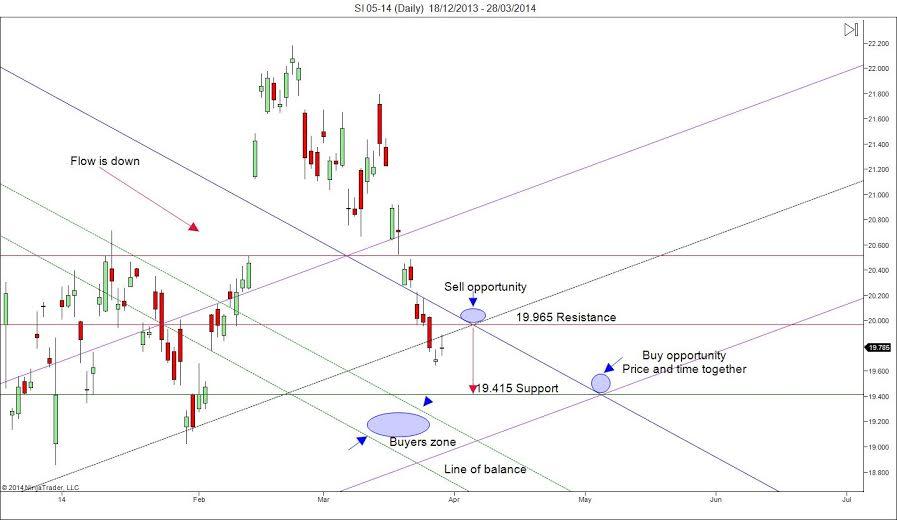
In my last report regarding silver I said, “Cover short on corrections at the 19.73 to 19.18 levels and go long on a weekly reversal stop. If long, use the 19.18 level as a Stop Close Only and Good Till Cancelled order. Look to take some profits on longs, as we reach the 21.25 and 22.02 levels during the week.”
The silver market made a low of 19.58 last week as it fulfilled and completed this second corrective wave pattern triggering the initial Buy signal at 19.73 mentioned above. With the market closing above this first level of support, it increases the probabilities greatly that the intermediate bottom is in place. Use last week’s lows as a protected weekly stop. If stopped out re-enter the longs on a test of 19.18. This is a low probability count in my opinion but a historic buy if tested. A close above 20 would trigger additional buyers as we move into the 21.25 to 22.02 area and weekly swing resistance levels.
Disclosure: The information in the Market Commentaries was obtained from sources believed to be reliable, but we do not guarantee its accuracy. Neither the information nor any opinion expressed therein constitutes a solicitation of the purchase or sale of any futures or options contracts. Trading derivatives financial instruments and precious metals involves significant risk of loss and is not suitable for everyone. Past performance is not necessarily indicative of future results.
Note: The Equity Management Academy prepared its subscribers way ahead of time for this potential bottom last week. We post all of our trading recommendations and market intelligence in the live trading room daily as well as gratis information you will find published in a timely manner on TraderPlanet. The results speak for themselves.

