
RSI, Better Price Oscillator Than MACD

Most traders are unaware there are three types of oscillators used for stock analysis. These are based on three different data streams –
- Price Oscillators that use price and time data,
- Volume Oscillators that use quantity and time,
- Hybrid Oscillators that use price, quantity, and time.
There are innumerable price and time indicators and many are oscillators, but one stands out from all the rest – Relative Strength Index (RSI). It is not the most popular, but it is the best price oscillator for short-term trading, and it is ideal for all trading styles, making it one of the most versatile. How the formula is calculated makes it unique among the many price and time oscillators available for trading.
Oscillators by their very nature are generally best used as short-term trading indicators. Long-term investing should not use oscillators for overall analysis of a long term position, however, Volume and Hybrid oscillators can be used for entries and exits of a long term position because they use quantity in their formula.
Most traders assume that oscillators have one function. The most basic and elementary interpretation for oscillators is to determine when a stock is overbought or oversold. I will take you beyond that simple analysis, to explore how the exceptional price and time oscillator RSI can outperform MACD as a momentum indicator.
The reason traders should look for momentum indicators other than MACD is because High Frequency Traders (HFTs) regularly use algorithms that track retail-trade orders using MACD. When found, they then front run the orders, which are more slowly executed than the HFT millisecond trading, which then drives price ahead of the retail trader’s ability to enter or exit the stock. This heavy use of MACD as a primary HFT strategy caused many professional traders to abandon MACD a long time ago.
The lesser used RSI indicator, originally created by Welles Wilder, has several “knock-off” versions with minor changes made by other indicator creators. It is best to use the “original” indicator rather than a knock-off, as empirical evidence continues to show weaker analysis with the knock off indicators.
RSI has not been as popular with retail traders as MACD because most charting software systems and training seminars only teach the single-line RSI analysis of overbought at the 70% line and oversold at the 30% line. However, this amazing indicator has far more usefulness when a subordinate indicator or secondary RSI line is added to the chart.
The RSI indicator is one of the originally constructed indicators (aka, 24 Primary). It is not a variation of a primary indicator created for stock trading. Therefore it can be used with other primary indicators, or any subordinate indicator a trader wishes to use. How this is then constructed depends upon the trading style or styles to be used, the intent of the trade, the duration of the trade, and the experience as well as educational level of the retail trader.
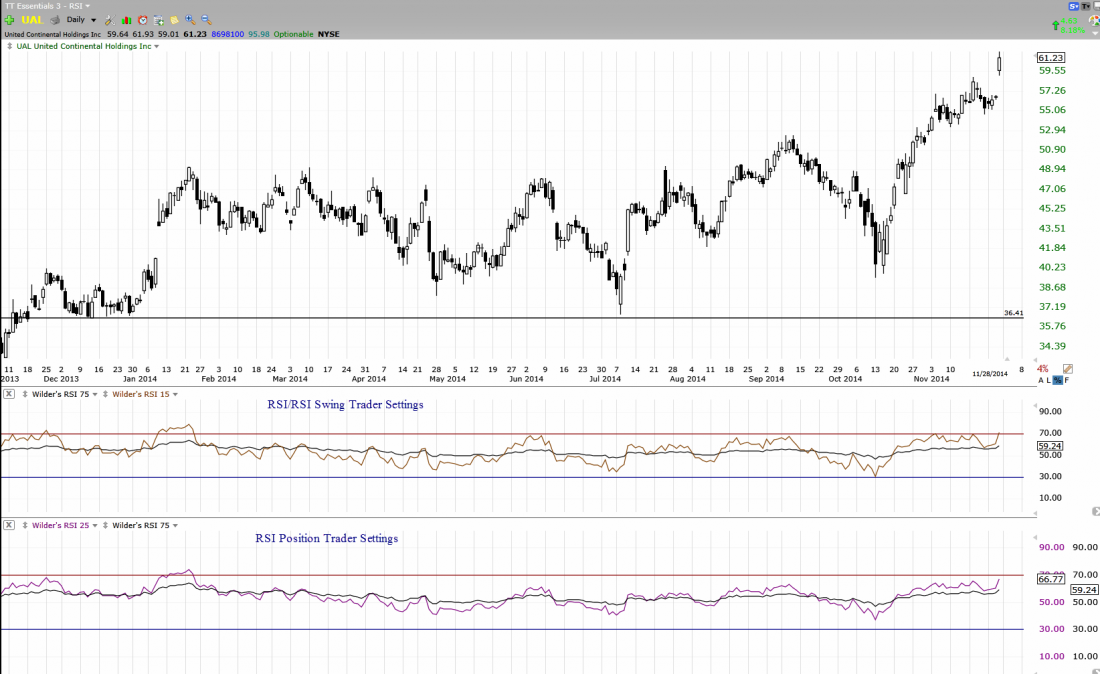
The chart example below (see end of article) combines a longer RSI with a shorter RSI, which is similar to how MACD is constructed. What makes RSI completely different from MACD is that the Moving Average Convergence and Divergence indicator is based on moving averages crossing, one shorter and one longer.
RSI has a unique quality because it is a comparative or relational indicator, since it leads price, rather than just a moving average crossover, which tends to lag price, meaning price must move before the indicator can cross over.
This indicator leads because RSI compares the current price to the previous price based on the period setting. In this instance, the chart shows a 15-day relational comparative price analysis, which is ideal for Swing Trading, and a 25-day relational/comparative price analysis, which is ideal for Position Trading.
I add a second, longer RSI of 75 to both, which can also be adjusted as needed. Now, the RSI chart window not only has a high line of 70 and a low line of 30, but also a floating center line, which is extremely useful for crossover signals and confirmation patterns. Crossovers occur sooner, and confirmation of trend continuation is much more reliable than other oscillators or momentum indicators.
When used in this manner, RSI is far superior to MACD. It provides better entry signals and a clearer holding pattern when stocks shift sideways.
The second chart example below shows RSI/RSI confirming that this stock is going to move up, while MACD is showing a signal for the stock to move down.
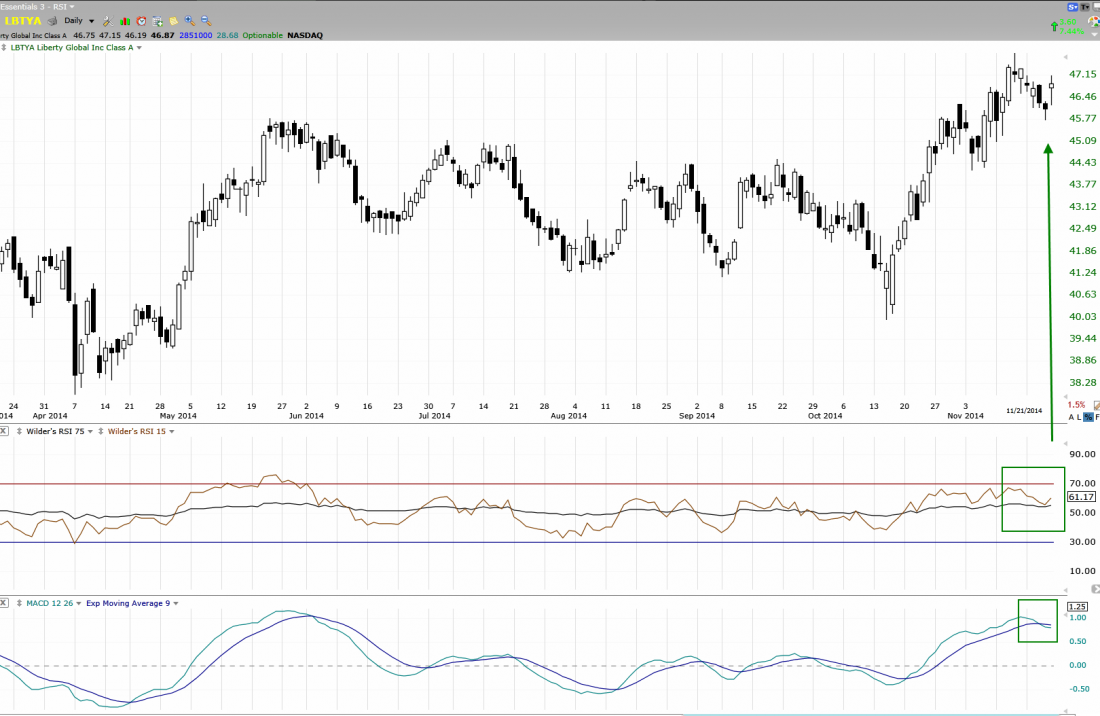
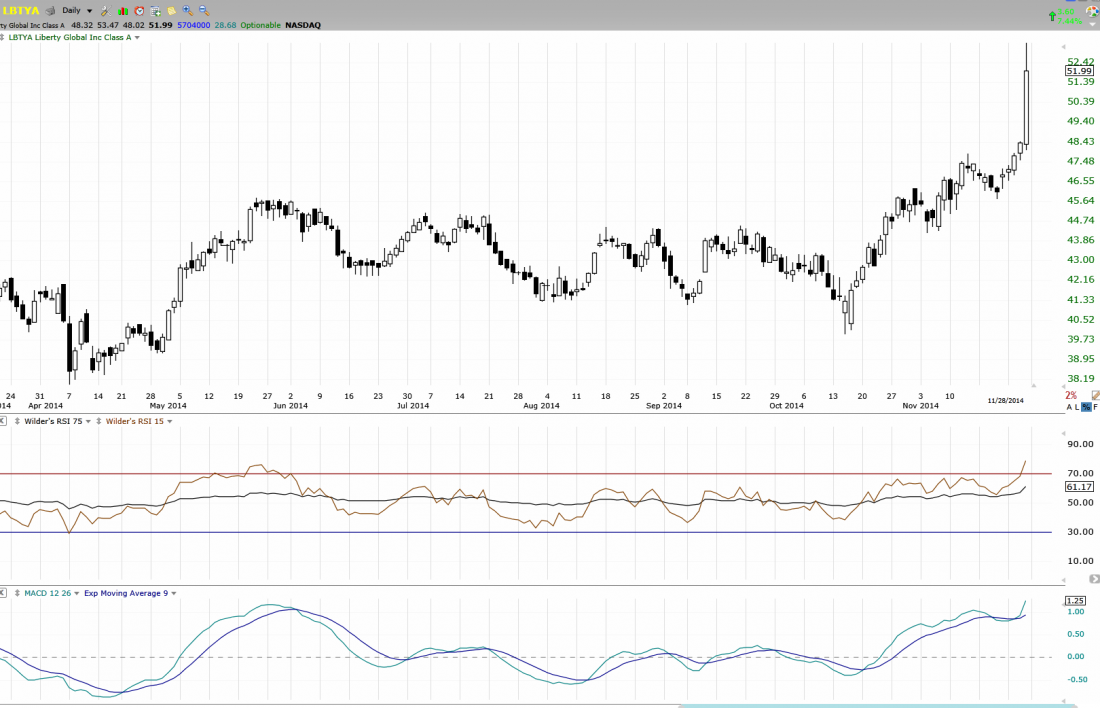
Therefore traders using MACD would exit, while traders using RSI would hold consequently earning excellent profit. The third chart example shows the results.
Another aspect of RSI that is unique to this type of relational comparative price oscillator over any momentum indicator like MACD, is the fact that the line can and does form an extreme top or bottom shape in the chart window. This is a hugely important trigger signal for short-term Swing and Momentum traders, as it allows for a much earlier entry before a stock moves up.
The fourth chart example shows a very common V bottom formation of price which frequently forms prior to a Momentum or Platform price action. RSI clearly signals several days ahead of MACD allowing the trader to enter far sooner and earn higher profits during sideways market conditions ahead of huge velocity runs. Even one day leading can make a huge difference in profitability at the end of the month for a retail trader. By watching for bottoming formations for example V and W, as well as Head & Shoulders in the RSI chart window, a trader can enter even before the crossover occurs.
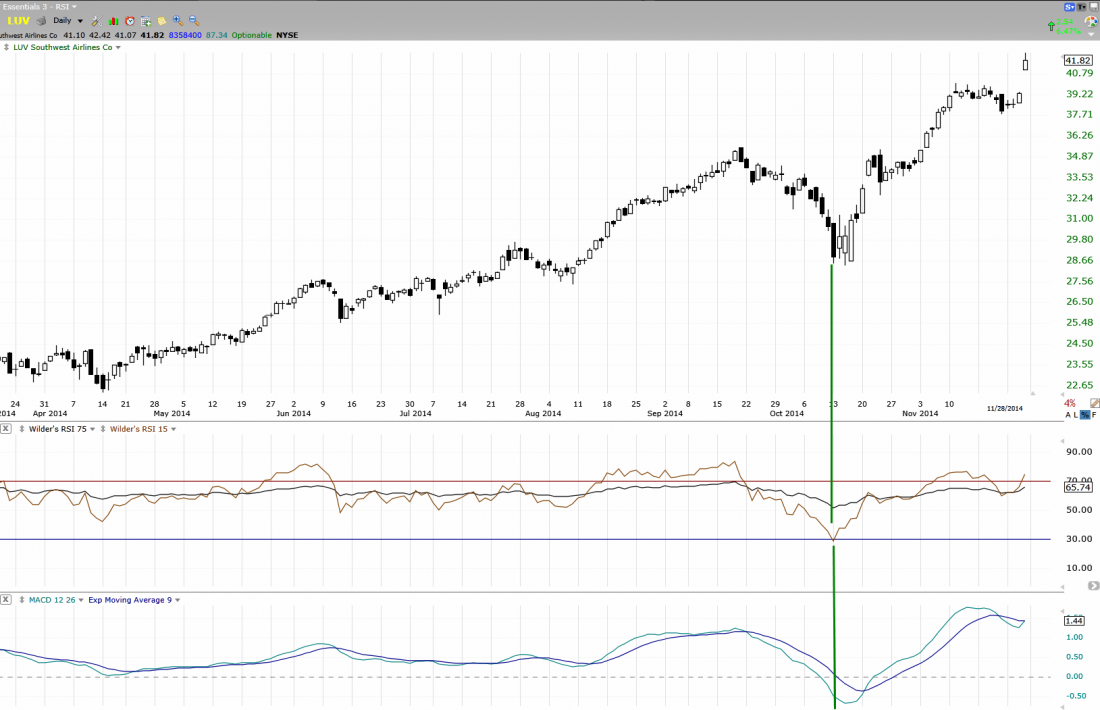
In addition RSI defines with precision the strength of the run, allowing for adjustments in trading decisions when a stock stalls or rests. MACD has no sensitivity to sideways action and, therefore, is unable to provide this kind of advanced analysis which helps guide a trader as to when to continue to hold and when to exit the trade.
RSI is the most versatile of all the price and time oscillators currently available to retail traders. Each trader should consider their own unique trading style, parameters, and rules to adapt each indicator to their personal use and thereby create a professional set of indicators for themselves. Every professional has his or her own unique indicator set.
If a trader needs assistance in setting up his or her indicators with custom period settings and parameters, they should seek guidance from a professional on the best practices and methods for their indicator tool kit.
Trade wisely …
#####
Thank you for reading my article. For more information about TECHNITRADER, click here.
For more from this writer, check out …
Related Reading
How To Take Advantage Of High Frequency Trader Price Action
Disclaimer: All statements, whether expressed verbally or in writing are the opinions of TechniTrader its instructors and or employees, and are not to be construed as anything more than an opinion. Readers are responsible for making their own choices and decisions regarding all purchases or sales of stocks or issues. TechniTrader is not a broker or an investment advisor; it is strictly an educational service.
