
Apply Elliott Wave Principle: Wave Labelling

Without a doubt wave labelling is one of the most important skills an Elliott Wave practitioner must learn and work on.
It is of my opinion that this is where a lot of students of the principle fail in understanding and gaining the real benefits of the principle, this requires in-depth knowledge of the patterns, rules and guidelines. A diagram of an idealized Elliott Wave Cycle (of at least three degrees of trend) should always be in clear view of the analyst and under that multiple degrees of the wave labelling the practitioner is using.
You will find the most common labelling list in Frost & Prechter’s “Elliott Wave Principle Key To Market Behavior” if you choose to change from their suggestion stick to it and have it close to hand. Figure 1 shows and example.
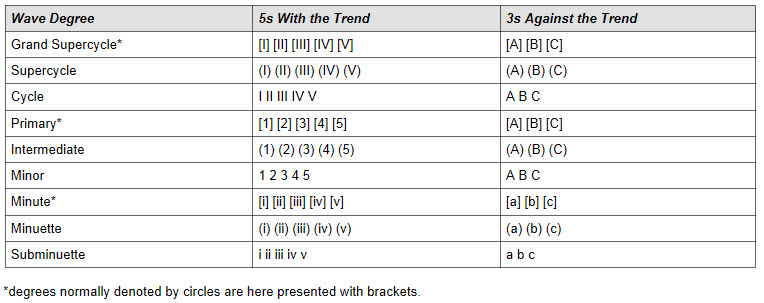
Tip: Adding colour will help in avoiding confusion of the degrees of trend.
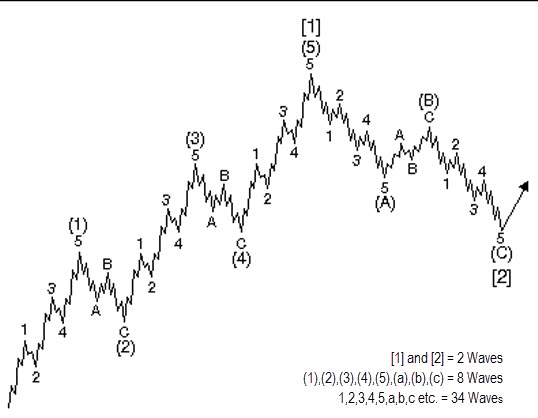
Below is an example of completed Primary waves [1] impulsive and wave [2] corrective. Within Primary wave [1] there are five impulsive waves at one lower degree called Intermediate degree, labelled (1) to (5) and each of those impulsive waves at Intermediate degree have five more impulsive waves at a lower degree again called Minor degree labelled 1 to 5 (two degrees lower than Primary degree). After each of the five wave impulses are complete there is always a correction, in this example the corrections are all zigzags, the bigger the five wave count the larger the correction.
It is not Fibonacci Lines or Fibonacci Time Zones that are used to measure wave degrees, it is the internal counts of the waves that will determine when one degree has completed and the other should now be under way. One cannot assume wave degree from time frame either; the internal count must be there. The only relationship between time frame and degree labelling is the further out you go on time the higher the degree you will more likely be looking at. But you can’t just assume daily means primary degree. Fibonacci measurements can be used to guide one in determining their wave labelling but they are not used to measure wave degree size. Anticipating the change from one cycle (degree) to the next relies on your understanding of wave structure and labelling.
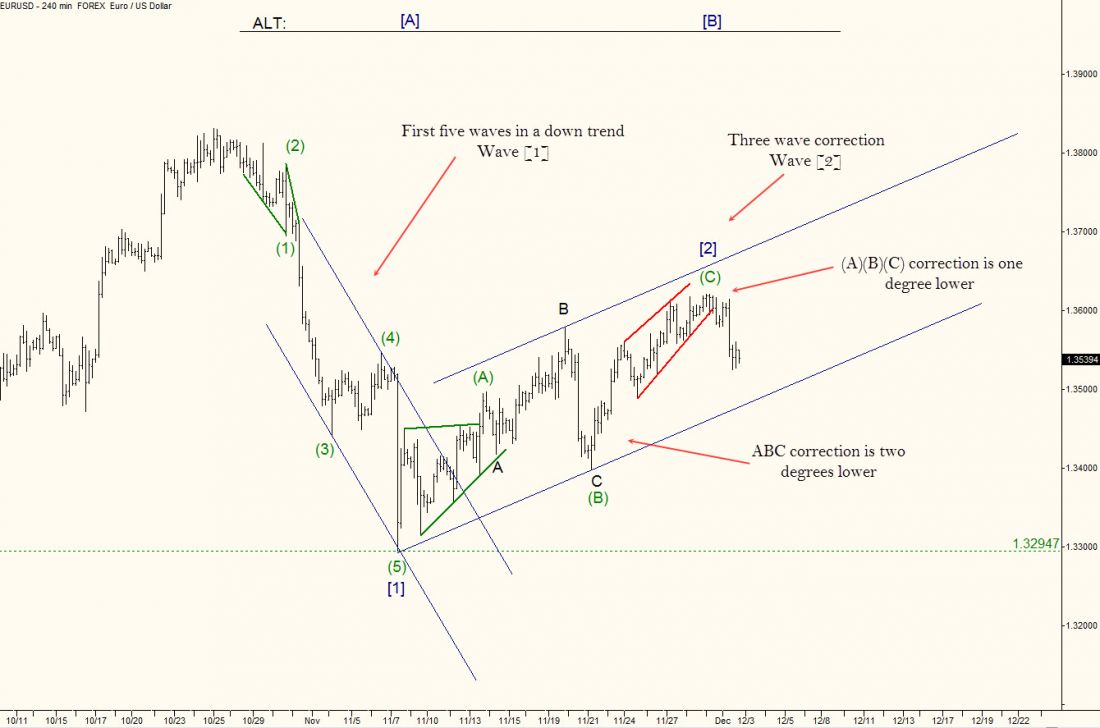
Five-wave structures, either impulse waves or diagonals, always make progress in the direction of the main trend at next higher degree. For example, wave (C) of an (A)(B)(C) correction, is moving in the direction of wave [2] (of that trend) which is one higher degree. But could be moving against the trend of two degrees higher which would be the direction of which these waves [1] and [2] are part of (bear market example shown)
To determine whether there is a trend change, first look for a move in the opposite direction that breaks the channel formed by the preceding pattern. Then look at the context to determine the extent of the trend change. Context refers to the pattern at next higher degree of which these moves are a part (move out to larger time frames – multiple of four is good, 15 Min to 60 min, 60 min to 240 min). For example, a five-wave move down may be wave 3 of a larger impulse wave (or the c wave of a three wave zigzag). In that case, a five-wave move up that breaks the trend channel of wave 3 could be wave A of a zigzag for wave 4, as opposed to a new major trend to the upside. Wave one of wave 5 down would possibly be in force after a five-wave move down breaks the trend channel formed by the zigzag in wave 4. By putting this correction in context of the size of the initial five wave move or the correction and then the break of the channelling this correction formed, the analyst would take the opinion that it is a third wave that was corrected and wave 5 is now under way.
As mentioned in previous articles channelling is a very powerful guideline technique; Fibonacci measurements as well as indicators (such as RSI) could also be used to help determine the termination of a Fifth wave or a C wave but it is the context of the termination that one has to be able to understand. With this the analyst knows when to expect a change of degree prior to it happening. The analyst must get over the frustration of getting the labelling wrong or having to go out a degree and re-label everything but that is all part of using the WP, there is no room for shortcuts when it comes to labelling.
= = =
Learn more about Madden’s firm: Elliott Wave Ireland here.
RELATED READING
Read another story by this author
