
Do You Surf the Market Waves?

Have you ever looked at the waves of a market? “Waves?” You may wonder: “Waves are for surfers. What do waves have to do with the markets?”
Plenty.
The Wave Chart
Reading the market through its waves has been known for over 100 years, but traders may not know how to view the market through this unique perspective. The ‘wave chart’ was originally conceived by Richard Wyckoff, considered by many of today’s top traders as the father of technical analysis.
Wyckoff noted that markets move in waves. There is an ebb and flow to the markets which can tell the next likely move of the market. Let’s see how a wave trader surfs the market waves.
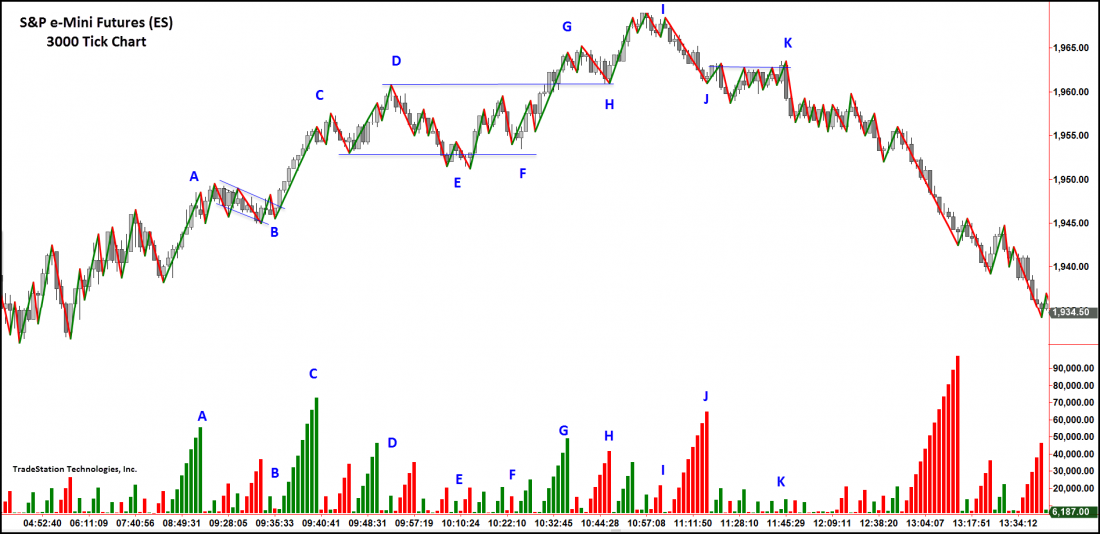
The intraday chart of the S&P e-mini futures highlights the up and down waves of a recent trading day. It also shows the volume of each wave as a replacement for the standard volume histogram.
Bullish Indications and a Long Wave Trade
Just before the US open at A, we see a large up wave accompanied by unmistakably increased volume. This indicates buyers are in control of the market. The market has tipped its hand, giving the wave trader a clear directional viewpoint for trading the morning session. Right at the open at B, the bull flag pattern draws no selling (small down waves and down volume) and signals the first trade of the day.
The rewards are immediate with a brisk rally on good volume to C. Note the up wave and volume are larger than down waves, revealing buyers are aggressive this morning.
Pullback and Another Long Trade
At D the up waves shorten and the volume also lessens a bit, indicating demand is tiring at this level for the moment. A careful assessment of the price action in this area would confirm that the market is preparing for a pullback, giving the short-term trader the option to book profits.
The pullback down to E occurs on small down waves with light and diminishing wave volume. A trade occurs at E as the selling completely dries up. The small pullback to F is a test before going higher.
The same bullish pattern occurs with a strong up wave and volume at G. Buyers remain dominant.
A Change of Behavior
The wave trader would surely notice the wave volume at H. Suddenly, heavier downside volume has come into the market. Price holds at support, but the volume is a red flag that selling may be trying to wrest control from the buyers.
Buyers flinch on the rally to I. The up wave shortens and the up volume diminishes. There is no more demand at the top of the trend. Any open long trades should be closed.
Sellers now step in and sell the market down to J on the largest downside volume of the day. The down wave has also lengthened. The behavior of the market, starting at H, has changed. The wave trader will see these distinct chart indications and prepare to go short.
A Short Wave Trade
A solid short opportunity comes at K. Notice the up waves are small and the up volume tiny. Buyers have lost control of the market and the wave trader steps in to ride the coattails of the now dominate force of the market: the sellers.
All markets move by supply and demand. The waves of the market measure supply and demand better than any other indicator. If you seek success in trading, you may want to consider learning how to learn the waves of the market. David Weis, market analyst and trader, developed the Weis Wave you see here to track the market’s waves and volume. You can learn more about this indicator and how to surf the waves of the market at the author’s website where numerous examples of this unique market perspective are freely offered. Just click here.
