Trading 101: Know Your TimeFrame

Forecasting is fun, but it leads to many errors in the process. We hear them all time, someone trying to be a hero but often failing miserably in their predictions. I read a quote last week by Howard Simons of the ‘Iron Law’ of forecasting (for economists): Give ’em a number or give ’em a date, but don’t ever give ’em both. Indeed, trying to forecast is quite difficult, one can go back and forth from hero to goat several times. Keep laying out a forecast and eventually you’ll be right, but it certainly depends on your time frame.
Forecasting the stock market and performance has almost always doomed the purveyor of information at some point. Oh sure, some get it right – and desire to be remembered for that one great call among the many bad ones. Yet, the odds are against constantly being wrong, in a coin flip situation the odd are still 50/50 (unless it’s a two-headed coin!).
Knowing your time frame allows you to drill down and find the characteristics that may define the next move(s). In markets, we can make a determination of direction on just about any time frame, but our experiences with trends and patterns is of the utmost importance. We can use this analysis to form a basis of opinion about future prices, hence a forecast. But, how can certain time frames actually lead the way rather than leading us astray? We can make grave errors in analysis by simply not understanding the time frames and expectations for a potential move.
We can look at a 15 minute chart of a stock or index and get a completely different read than a daily chart. Similarly, we can also look at longer time frames such as the weekly or monthly and receive the same contrasting data. This is often seen in equity stock charts when the market is choppy or in a bear phase such as we are currently in. Yet, sometimes we have charts across different time zones that actually converge so we can come up with the same conclusion.
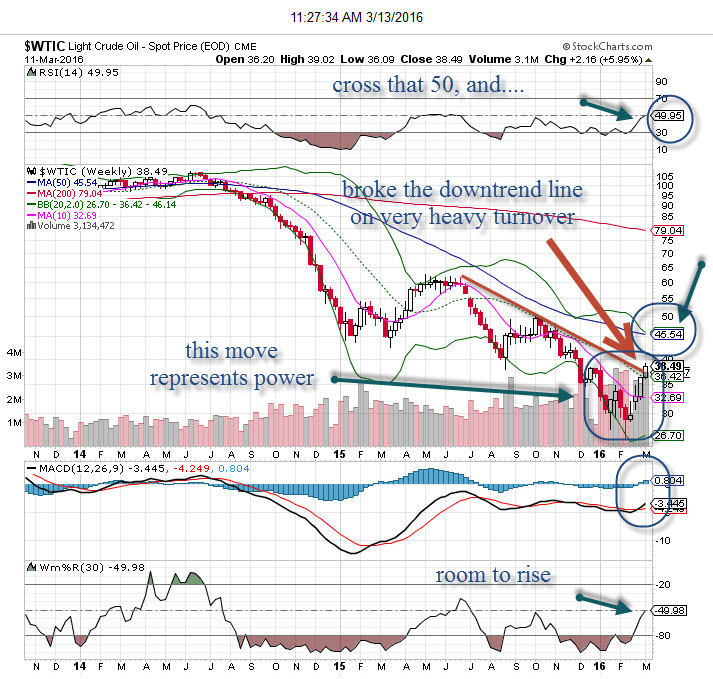
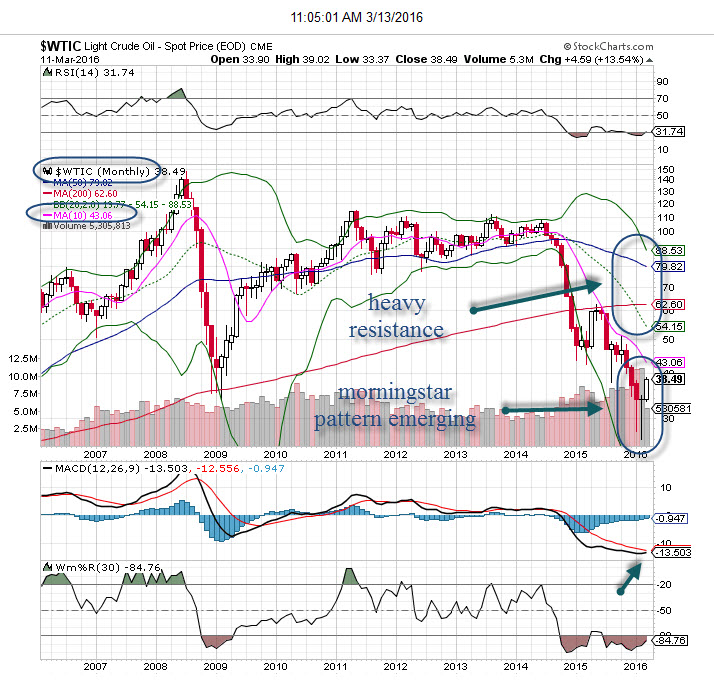
Take a look at the charts of crude oil. We see on a monthly chart the formation of a bullish ‘morningstar’ pattern, yet another month (April) will confirm this pattern. That is roughly six weeks away, so we really cannot put this chart in the bullish camp as of yet. The weekly chart is the most bullish of all and forecasting higher prices ahead, extending out toward the $43-$45 level. This may take several weeks to play out, and at that point the monthly chart may be confirmed. This is good information and can be played with a high degree of reliability based on previous data points and probabilities.