
Combine TA Tools for Tight Stops and Targets

Before using any analytical trading tool or technique you should learn it inside out.
Traders need to know exactly what they require from the tool or technique to make a trading decision and be able to make that decision instantaneously. This sounds easier than it actually is and takes a lot of time on the charts to get to the stage where you truly trust your intuition.
THE APPROACH
I am a big proponent of channeling techniques and I find them to be a very simple but a powerful guideline for the wave principle and trading in general. R N Elliott wrote about three types of channeling techniques, another I came across was from Jeffery Kennedy at Elliott Wave International which he named the Kennedy Channeling Technique (KCT) or The Basing Channel.
DRAW YOUR CHANNELS
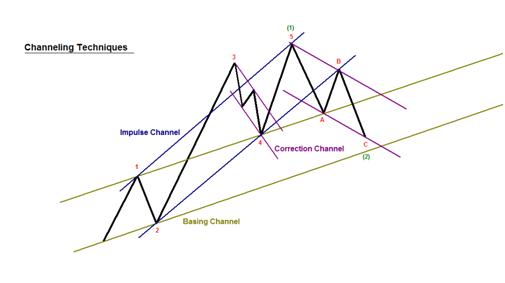
This first chart shows some of the channeling techniques used as guidelines of wave formation.
- The gold lines represent the Basing Channel (or KCT) this channel is established from waves one and two within an impulse wave.
- The blue line represents the Impulse Channel this can be taken from the end of wave one to the top of wave 3 to locate wave four and also from waves two and four to the end of wave 1 as shown (when wave three is steep the end of wave one is used) or the end of wave three to locate wave five.
- The purple lines represent Corrective Wave Channels.
(TIP: When using channeling or trendlines allocate colors, weights and dashing to give lines specific meaning. That way when there are multiple lines on the chart you will know at a glance their meaning.)
ADD IN FIB RATIOS
Once comfortable with the channeling techniques listed above we can take the guidelines to a greater level of accuracy by adding Fibonacci Ratios to them. These levels then give both internal and external target levels for occasions when price fails to reach or exceeds the channel boundary lines. The beauty with the wave principle is we can line up our levels with the expected completion of a pattern / wave count. With the WP we are often dealing with multiple degrees of trend; this analysis can be used on all degrees and will add to existing clusters of support and resistance.
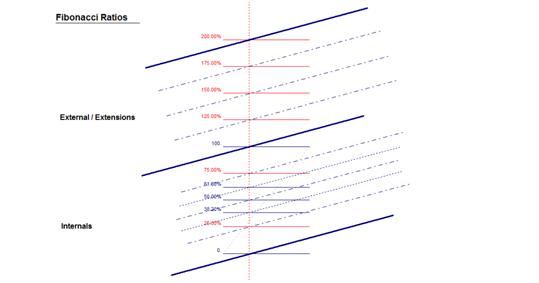
In this Fibonacci study you will have Internal Ratios and External Ratios; it is best practice to set up these levels manually.
- Once you have located the channel draw a vertical line through it, where the line intersects the channel lines pull the Fibonacci ratios from the points of intersection (Pull from top to bottom for a rising trend and from bottom to top for a falling trend).
- In the example below I show the internal Fib numbers of the original channel, the numbers outside of that are external or extensions. Whether you are studying the start of a trend or if the trend is well under way you have to always start at the origin for greatest accuracy. From here you take multiples of the original channel – x1, x2, x3 etc. The key is to stick with the original channel and project all the levels from here, this is why it is best to do it manually, you can put in and take out lines as required and not congest the chart.
- Each of these multiples can be divided again with ratios just like the first channel. Note I have used 25% and 75% with the fib tool, I have found these to be very useful levels while testing this. If you think about it both levels are within a natural fib cluster, the 23.6% and the 78.6% ratios are just about the half of a half of a channel so subtracting levels and division levels meeting naturally.
KEY POINT
The most important thing to all of this is to be sure you have located the correct channel that price is aligning with. To do this extend the lines both left and right to see what lines have had significance in the past, you will know when you have the correct channel, price will have shown respect to the lines. Take note of the ratio of these lines as the same ratios tend to pop up with later multiples. With the WP you will have a good idea for channel location as counts start from a significant low or high point no matter what the time frame.
AMAZON EXAMPLE
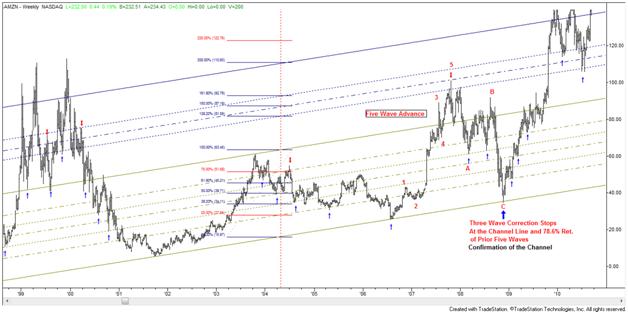
Here is the stock Amazon (AMZN) on a weekly time frame. The analysis starts form the low of Late ’01, this looks like a significant low, more than likely the end of a large degree Flat correction. Price has taken off from this point in what counts best as a series of ones and twos.
- First step is to draw the first channel (Basing Channel as described above)
- Divide this channel into its ratios: 25, 38.2, 50, 68.1 and 75.
- Draw parallel lines to the channel and place them where the vertical line intersects the ratios
- Extend lines left and right to see if you have found the correct ratios.
In the chart below price has shown a lot of respect for the internal ratios in the past and in the future. I have left out the wave count for clarity remember you are using the lines to aid your count so you don’t need to put every fib line on the chart. These lines will add to other technical zones and counts where you are expecting a significant turn in price, pick out the noteworthy ones.
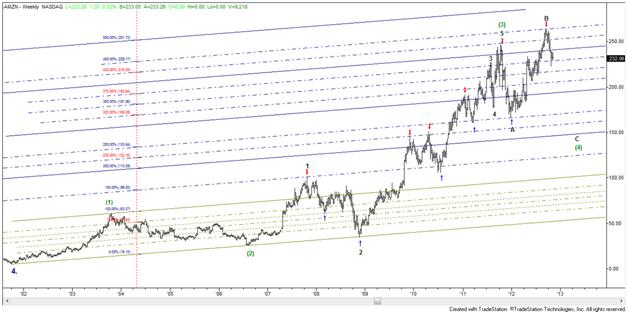
The internal ratios once extended have shown enough significance to start projecting some extensions. When we look at some more data we can see the same multiples from the original channel have coincided with key milestones with the advance in price, the fifth wave of impulses and final waves of corrections.
TIGHT STOPS AND TARGETS
These examples demonstrate the potential from a basing channel and a wave count. When you line up some of the other channels, guidelines for wave formation and TA techniques you can really add probability to your wave count and trading. Here we looked at an impulse channel but the same technique can be performed on any of the channels used in guidelines of wave formation.
BOTTOM LINE?
This type of analysis gives me very tight technical stops and targets so each position I take can have the maximum reward: risk.
#####
