

No matter what chart type you use, the first thing you should try to determine as a trader is the trend of market. You can use all kinds of clever ideas and sophisticated techniques to arrive at your trading decisions, but a basic building block of whatever trading style you use should be trend analysis. The expression, “The trend is your friend,” is an market axiom for good reason.
Here is what respected technical analyst John J. Murphy says about trend lines in his excellent book, Technical Analysis of the Futures Markets: “The importance of trading in the direction of the major trend cannot be overstated. The danger in placing too much importance on oscillators, by themselves, is the temptation to use divergence as an excuse to initiate trades contrary to the general trend. This action generally proves a costly and painful exercise. The oscillator, as useful as it is, is just one tool among many others and must always be used as an aid, not a substitute, for basic trend analysis.”
UPTREND LINES AND DOWNTREND LINES
The definition of a trend is pretty simple. An uptrend is a series of higher highs and higher lows. A downtrend is a series of lower highs and lower lows.
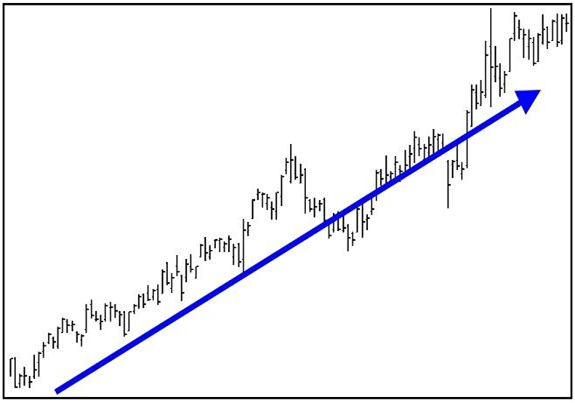
Source: VantagePoint Intermarket Analysis Software
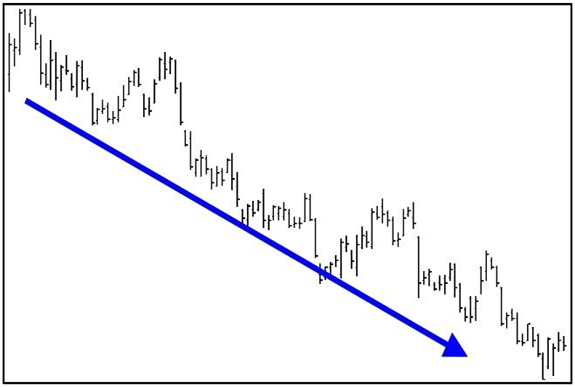
Source: VantagePoint Intermarket Analysis Software
Like much of technical analysis, however, drawing trend lines is more art than science. When drawing an uptrend line, you draw a straight line up to the right along successive “reaction” lows (see chart below). During a downtrend, a line is drawn to the right along successive rally peaks (see chart below). It’s important to note that the more times the trend line touches rally peaks or reaction lows, the more powerful and more valid the trend line becomes.
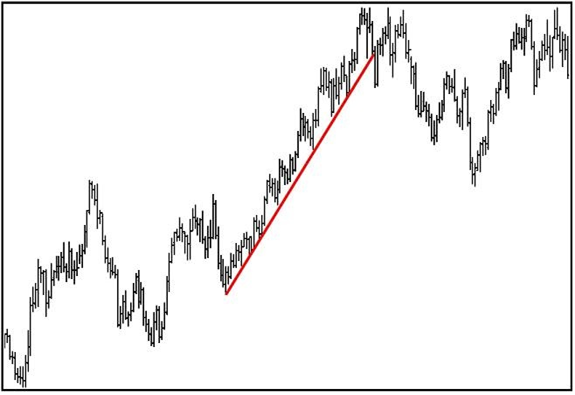
Source: VantagePoint Intermarket Analysis Software
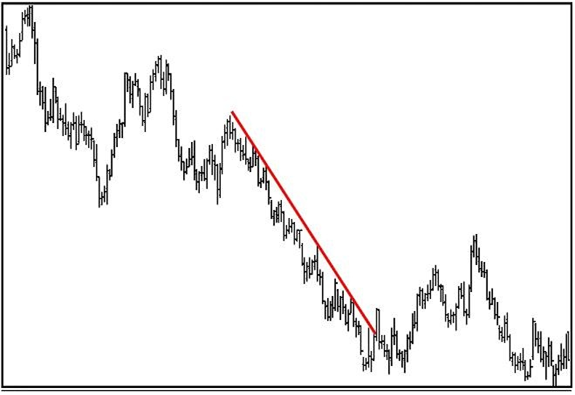
Source: VantagePoint Intermarket Analysis Software
As mentioned in the basic rules of technical analysis, a trend in motion tends to stay in motion. Of course, at some point any trend will end. One rule for negating trend lines is that prices must penetrate the trend line resistance or support level and then show evidence of follow-through strength or weakness during the following trading sessions.
TRADING CHANNELS
In some cases, you can draw a line parallel to the uptrend or downtrend line to form a trading channel, providing some boundaries within which the trend unfolds. In an up trending move, the straight line across the reaction lows reveals the trend, and a parallel line across the highs defines the channel. In a down trending market, the straight line across the highs determines the trend and a channel line is drawn across the lows.
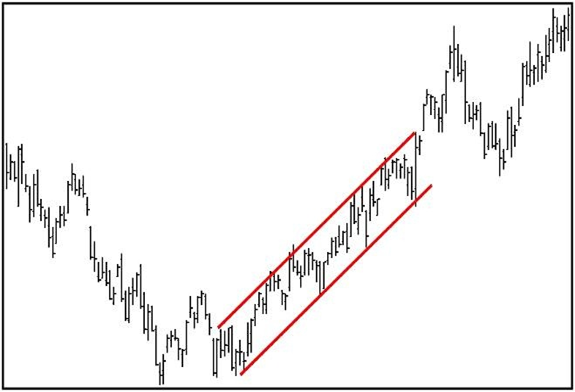
Source: VantagePoint Intermarket Analysis Software
Channels make the trend clearer and offer clues for positioning trades. In an uptrend, if prices approach the upper channel line, it may suggest the market is due for a short-term correction. Traders who want to be long may want to wait until prices return to the major trend line. Breakouts below the trend line or above the channel line can provide signals to initiate or exit positions.
SIDEWAYS TRADING RANGE
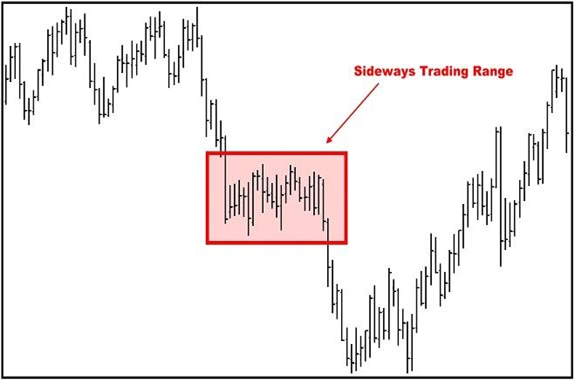
Source: VantagePoint Intermarket Analysis Software
Of course, prices do not always move up or down in trending action but spend much of their time chopping back and forth. This activity may form a sideways trading range or a basing or topping pattern when prices remain within a generally narrow band for a period of time. The longer the sideways action, the more powerful the breakout from the sideways trading range is likely to be.

