
One of the big challenges associated with trading and investing in the financial markets is developing an understanding of how different methodologies define VALUE. Investors, traders, and analysts all develop their own proprietary methods to try and define value quicker and more accurately than their competitors. It’s no easy task. Sometimes defining value is purely an intellectual exercise. However, sometimes it’s what’s needed to stay out of harm’s way.
In this article we will explore some economic indicators and critical thinking processes which have been beneficial in previous bear markets in stocks. They are certainly worthy of your attention today.
Let me explain.
Whenever we try to comprehend an INDEX, it helps a great deal to understand what the INDEX is and how it is constructed. For example, the S&P 500 is one of the most widely followed equity indices in the world. It’s designed to measure the performance of the large-cap segment of the U.S. equity market. The S&P 500 is a market-capitalization-weighted index, meaning the weight of each company in the index is determined by its market capitalization. This means a company worth $1 trillion has a larger percentage of the index than a smaller company. This is vital in understanding the performance of this asset.
Until you understand this reality, you can’t make sense of the index itself.
Since the beginning of the year, the S&P 500 Index is up 9.38%. Bulls are enthusiastic about the performance. Happy days are here again… Right?
Let’s do a little critical thinking and just dig into the major components.
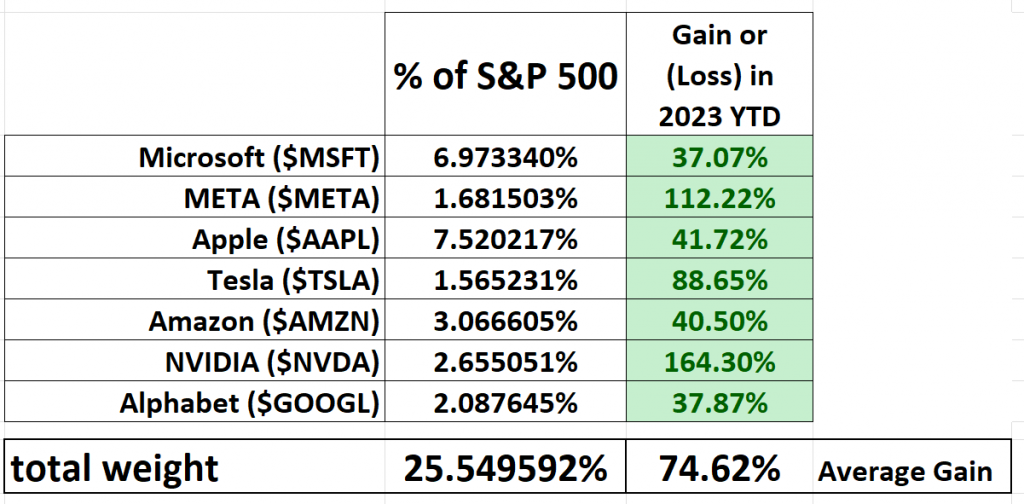
The graphic above shows 7 of the largest cap companies in the S&P 500 Index. These companies cumulatively account for 25.549% of the index. More importantly, their average gain so far in 2023 is 74.62%. (Even with performance leader $NVDA trading at 216 times earnings!)
So let me throw a little rain on the bull’s parade. That means that the remaining 493 companies in the index must be pretty negative to pull down the overall average of the index to 9.38%! If the top 7 companies are averaging gains of 74.62%, the remaining companies cumulatively would be responsible for a -65.24% cumulative negative return to create a 9.38% positive return.
We can verify this for ourselves very easily by simply checking the net performance of the EQUAL WEIGHT S&P 500 Index ($SPXEW). The S&P 500 Equal Weight Index gives the same weight to each company in the index, regardless of its size or market capitalization. In other words, each of the 500 companies represents 1/500, or 0.2%, of the index. This method gives a more balanced representation of the performance of all the companies in the index, rather than being skewed towards the performance of the larger companies.
This index and its performance can sometimes differ significantly from the market-cap-weighted S&P 500. When performance metrics diverge greatly between the market cap index and the equal weighting index it is a good idea to be extra cautious as these divergences are quite often warning signs of structural imbalances in the economy.
Here is what the comparison of these two different indexes looks like as I write these words:
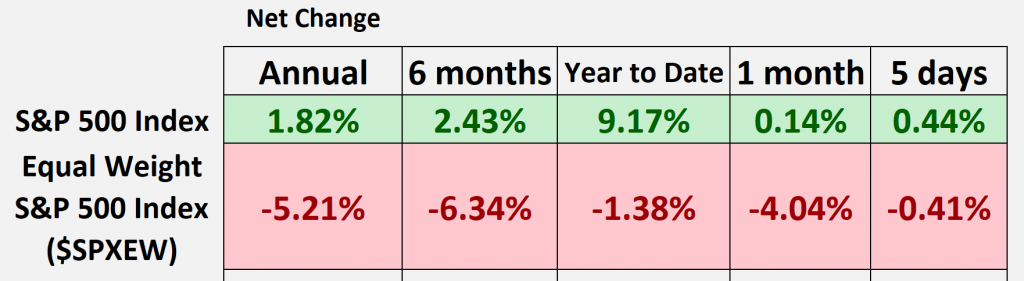
Notice anything peculiar here?
The equal weighted ($SPXEW) is negative across all time frames while the market cap index ($SPX) is positive across all time frames.
Maybe it’s an aberration. Let’s look at the performance of the Russell 2000 Index ($RUT) across all time frames. The Russell 2000 Index is a market-capitalization-weighted index comprised of the smallest 2,000 companies in the Russell 3000 Index.
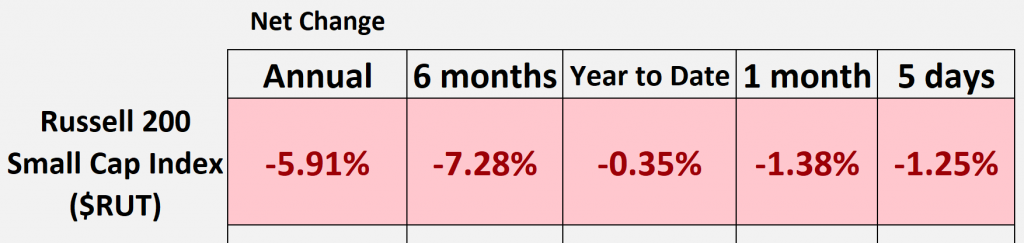
The index includes the smallest 2,000 companies from the Russell 3000 Index, representing approximately 10% of the Russell 3000’s total market capitalization. It serves as a benchmark for small-cap stocks in the U.S., giving investors a tool to measure the performance of the small-cap segment of the U.S. equity universe. It’s often used as a proxy for riskier, more speculative investments, as small-cap stocks are generally considered to have higher growth potential, but also more volatility, than large-cap stocks. While the Russell 2000 performance is not horrific, there is no reason to be enthusiastic about the small cap sector of the market.
I hate to remind everyone of the banking crisis that was front page headline news a few weeks ago. These small-cap companies traditionally are customers of the regional banks which are being decimated by the current Fed policy.
But let’s move on and look at some other metrics that have been important in previous bear markets. One of my favorite fundamental indicators is called the earnings yield. This metric provides insights that can be used to compare the relative attractiveness of stocks to different asset classes.
Here’s how to calculate the earnings yield on stocks:
Earnings Yield = (Earnings per Share / Stock Price)
The earnings yield indicates how much return an investor can expect to earn from the company’s earnings, relative to the investment made in the stock. It’s essentially the inverse of the price-to-earnings (P/E) ratio, and it helps investors assess the profitability and valuation of a stock.
The importance of the earnings yield to investors lies in its ability to provide a measure of relative value and a basis for comparison across different investments. Here are a few reasons why it is relevant to investors:
Currently, the earnings yield on the S&P 500 Index is 5.46%. Money managers use this metric to define a risk premium. Ideally, they want this metric to be substantially higher than what they can earn in a risk-free instrument like a treasury bill. The principle here is that money will always move to wherever it is treated best. Money managers are always chasing yield and recognize the need to balance return against potential risk.
So here is the simple dilemma: If stocks in the S&P 500 are offering a 5.46% yield let’s compare that to the rate offered by a 3-month treasury bill. Investors can compare the earnings yield on stocks with the yields on other investments, such as bonds or savings accounts. This helps in evaluating the potential returns from investing in stocks compared to alternative investment options.
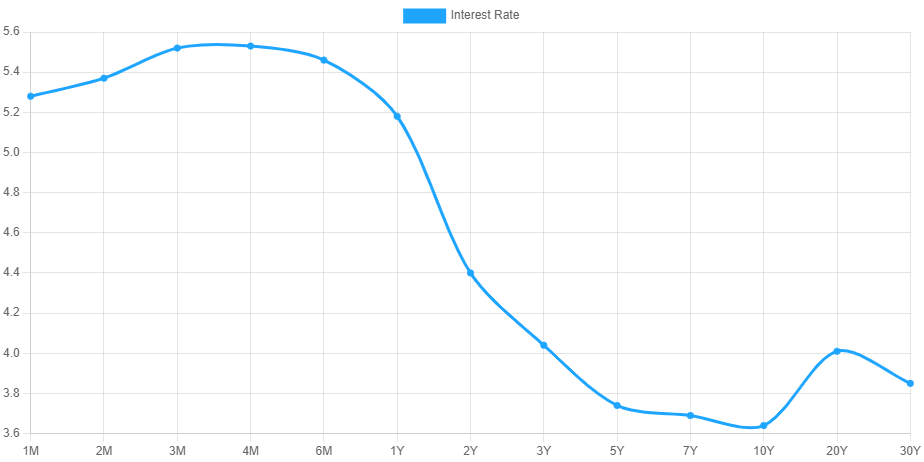
The graphic above shows the current yields available on the yield curve. Would you as an investor prefer to give Uncle Sam your money and earn 5.45% over 3 months? Or by investing in the S&P 500, with all the additional volatility and risk and zero risk premium, receive a potential similar return. (Emphasis on the word potential).
The earnings yield and risk premium for investing in stocks is zero. In other words, you’re not being compensated for taking additional risk and investing in stocks. Instead, it becomes clear that investing in Treasuries is much safer and risk free.
Traditionally investors always require a substantial risk premium to invest in stocks over risk free assets. When the risk premium is non-existent, as it is today, probabilities favor that the earnings yield on the S&P 500 has to increase substantially to make stocks more attractive. Hint: The only way that the earnings yield can become more attractive is that companies need to earn more, or the price of the index needs to fall substantially to offer a higher percentage return.
This question is front and center now. When RISK premium on the earnings yield evaporates, it portends that risk free assets are much more attractive than stocks.
But this debate also recalls the recent debt ceiling negotiations which have been unfolding in Congress. Unfortunately, the debate has been positioned along political lines. All indications seem to be that the debt ceiling will be raised, and the government will spend more money. If $1 trillion extra dollars a year are going to be spent by government, shouldn’t we be asking where is that money going to come from and who is going to finance it? Of course, the government will finance the new funding through the printing press, which debases the currency, and is inflationary, but the additional problem for stocks is that if bond yields remain the same or creep slightly higher there will be a huge additional supply of high yielding treasuries competing for money that is currently tied up in the stock market.
My two cents: monitor the earnings yield on the S&P 500 and compare that rate to the risk-free return on 3-month T-bills. History shows that when they are at parity with one another, the odds favor that money will flow to treasury bills and out of stocks.
Lastly, let’s look at valuation of the stock market according to the Warren Buffett indicator.
The “Warren Buffett indicator,” also known as the “Buffett Indicator” or the “Market Cap to GDP ratio,” is a financial metric that compares the total market capitalization of a country’s stock market to its Gross Domestic Product (GDP). It is a tool that Warren Buffett, a renowned investor, has mentioned in the past and is associated with his investment philosophy.
The Buffett Indicator is calculated by dividing the total market capitalization of all publicly traded stocks by the country’s GDP. The formula can be expressed as:
Buffett Indicator = Total Market Cap / GDP
The Buffett Indicator is useful in assessing the overall valuation of the stock market relative to the size of the economy. It provides insights into whether the market may be overvalued or undervalued.
Overvaluation is generally defined in the context of the Buffett Indicator when the ratio is significantly above its historical average. The specific threshold for overvaluation may vary based on the time period being analyzed. When the Buffett Indicator is high, it suggests that the stock market may be overextended, with stock prices potentially outpacing the underlying economic fundamentals.
When stocks are considered overvalued based on the Buffett Indicator, investors may compare potential stock returns to the risk-free yields on Treasury bills. Treasury bills are typically considered low-risk investments that offer a guaranteed return. When stocks are overvalued, investors may question whether the potential returns from investing in stocks outweigh the comparatively safer and guaranteed returns from Treasury bills.
Investors may choose to allocate more of their portfolio towards Treasury bills or other lower-risk assets when stocks are overvalued, aiming to protect capital and mitigate potential losses. This approach reflects a more cautious stance towards the stock market and acknowledges the potential risks associated with overvalued conditions.
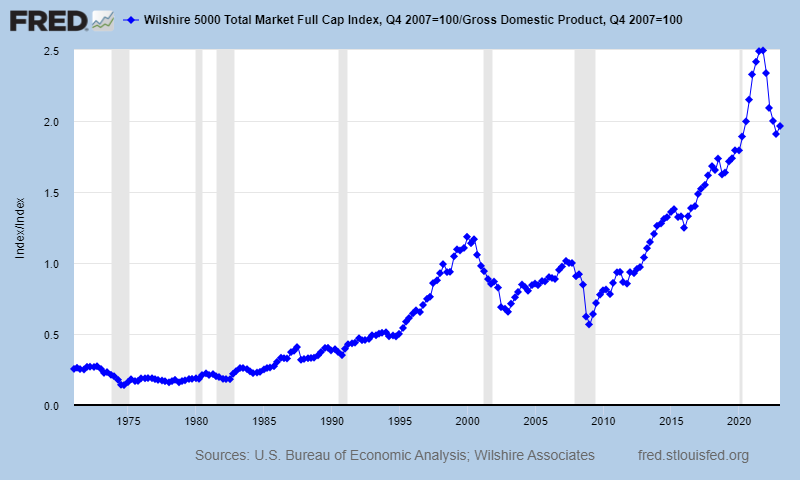
The Buffett Indicator is maintained by the St. Louis Fed. By any stretch of the imagination, you must conclude the indicator is telling us that the stock market is overvalued according to historical norms. While these norms do not exist in a world where the Fed manipulated interest rates to zero percent for several years, they do highlight the importance of critical thinking in the yield chase game of today. Over the last several years when interest rates were pushed to zero percent, the argument for investing in stocks was TINA (THERE IS NO ALTERNATIVE). With the Fed having hiked interest rates at the fastest pace in history, there currently is an alternative. To think otherwise is foolish. For the first time in 14 years, since the Great Financial Crisis, treasuries appear to offer less risk than stocks. Stated another way, an income-seeking investor, who has traditionally been risk averse, is currently receiving comparable yield by investing in bonds compared to an S&P 500 Index ETF.
While this sounds trivial on the surface, money always will go to wherever it is treated best and offered the highest return with the least amount of risk.
But this article will hopefully serve as a thought exercise on how you define value.
I showed you how the market cap based S&P 500 Index shows massively different returns than the equal weighted S&P 500 Index. That shows that the stock market is completely divorced from what is occurring in the economy. Next, you saw how there is no risk premium enticing investors to rake risks in stocks any longer.
Lastly, you saw a historical view of the Buffett indicator which shows we are still in nosebleed territory.
What does this mean to you as a trader?
I’ve offered my opinion on why I think stocks have some very strong headwinds ahead of them. I could be very wrong in my assessment. This is why I trade with artificial intelligence.
I am BEARISH. Which means I’m very aware of the bearish forecasts. When those bearish forecasts occur, I pounce on them.
Until then, I can embrace my opinions without going to the poorhouse. This is why the artificial intelligence is so valuable in today’s fast paced world. Everybody is entitled to their own opinions. But markets are very unforgiving. Machine learning, artificial intelligence and neural networks prove to be invaluable in helping to keep me on the right side of the right trend at the right time.
Here is why this is so important today.
Traditional economic theory is best represented by the following graphic.
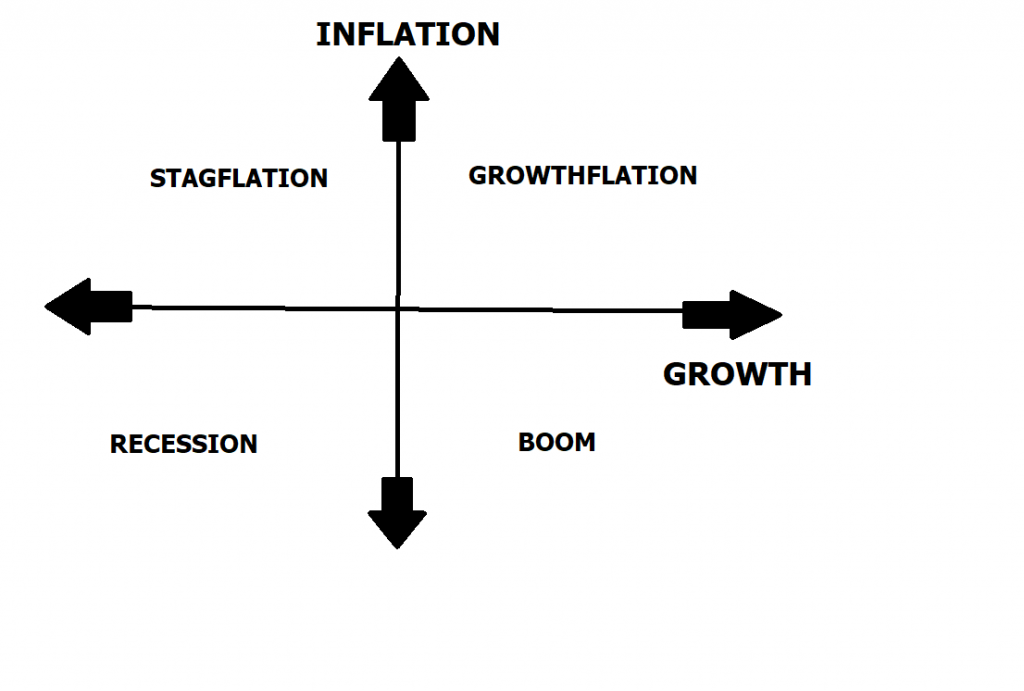
With decreasing growth and decreasing inflation the probabilities favor a recession in the near future.
That means you need to have a practical, repeatable, workable system for finding trends that do well in a recession.
What’s Your Best Chance to Make Money in The Financial Markets Today?
The Answer A.I. offers will surprise you.
Today Artificial Intelligence, Machine Learning and Neural Networks are an absolute necessity in protecting your portfolio.
I have a very strong opinion that stocks are going to go lower. But my “NORTH STAR” will always be the trend highlighted by artificial intelligence.
A.I. combined with neural networks are exactly the types of analytical horsepower you need to stay on the right side of the right trend at the right time.
If survival of the fittest makes you uneasy, stay out of this zero-sum game.
If you want to win, it’s all about who has the best tools.
Artificial intelligence is so powerful because it learns what doesn’t work, remembers it, and then focuses on other paths to find a solution. This is the Feedback Loop that is responsible for building the fortunes of every successful trader I know.
Visit With US and check out the A.I. at our Next Free Live Training.
It’s not magic. It’s machine learning.
Make it count.

IMPORTANT NOTICE!
THERE IS SUBSTANTIAL RISK OF LOSS ASSOCIATED WITH TRADING. ONLY RISK CAPITAL SHOULD BE USED TO TRADE. TRADING STOCKS, FUTURES, OPTIONS, FOREX, AND ETFs IS NOT SUITABLE FOR EVERYONE.
DISCLAIMER: STOCKS, FUTURES, OPTIONS, ETFs AND CURRENCY TRADING ALL HAVE LARGE POTENTIAL REWARDS, BUT THEY ALSO HAVE LARGE POTENTIAL RISK. YOU MUST BE AWARE OF THE RISKS AND BE WILLING TO ACCEPT THEM IN ORDER TO INVEST IN THESE MARKETS. DON’T TRADE WITH MONEY YOU CAN’T AFFORD TO LOSE. THIS ARTICLE AND WEBSITE IS NEITHER A SOLICITATION NOR AN OFFER TO BUY/SELL FUTURES, OPTIONS, STOCKS, OR CURRENCIES. NO REPRESENTATION IS BEING MADE THAT ANY ACCOUNT WILL OR IS LIKELY TO ACHIEVE PROFITS OR LOSSES SIMILAR TO THOSE DISCUSSED ON THIS ARTICLE OR WEBSITE. THE PAST PERFORMANCE OF ANY TRADING SYSTEM OR METHODOLOGY IS NOT NECESSARILY INDICATIVE OF FUTURE RESULTS. CFTC RULE 4.41 – HYPOTHETICAL OR SIMULATED PERFORMANCE RESULTS HAVE CERTAIN LIMITATIONS. UNLIKE AN ACTUAL PERFORMANCE RECORD, SIMULATED RESULTS DO NOT REPRESENT ACTUAL TRADING. ALSO, SINCE THE TRADES HAVE NOT BEEN EXECUTED, THE RESULTS MAY HAVE UNDER-OR-OVER COMPENSATED FOR THE IMPACT, IF ANY, OF CERTAIN MARKET FACTORS, SUCH AS LACK OF LIQUIDITY. SIMULATED TRADING PROGRAMS IN GENERAL ARE ALSO SUBJECT TO THE FACT THAT THEY ARE DESIGNED WITH THE BENEFIT OF HINDSIGHT. NO REPRESENTATION IS BEING MADE THAT ANY ACCOUNT WILL OR IS LIKELY TO ACHIEVE PROFIT OR LOSSES SIMILAR TO THOSE SHOWN.

