
![]()
Marvell Technology Group Ltd. ($MRVL) is a semiconductor company that was founded in 1995 by Sehat Sutardja, Weili Dai, and Pantas Sutardja. The company is headquartered in Hamilton, Bermuda, with a significant presence in Santa Clara, California, among other locations globally. Marvell has about 5000 employees.
Marvell designs and sells a broad range of products, including networking solutions, storage devices, and semiconductors. The company primarily generates its revenue by selling these products to customers across diverse industries such as telecommunications, automotive, consumer electronics, and data centers. Their products are fundamental for various applications, including data storage, computing, networking, and telecommunications. The biggest opportunities for Marvell lie in the burgeoning sectors of data centers, cloud computing, and the roll-out of 5G technologies. As these areas continue to expand, demand for Marvell’s products is expected to grow. Conversely, their business model also poses risks. The semiconductor industry is fiercely competitive and marked by rapid technological change. Plus, potential disruptions in their supply chain, given the complexity and global nature of semiconductor manufacturing, represent another challenge.
Marvell Technology Group Ltd. primarily generates its revenue by selling these products to customers in a wide range of industries, such as telecommunications, automotive, consumer electronics, and data centers. Their products are critical components for a range of applications, including data storage, computing, networking, and telecommunications. The company’s revenue also comes from licensing their technology to other businesses.
Wall Street analysts’ opinions about Marvell have varied over time but have been mostly positive about the company due to its strong product portfolio, strategic acquisitions, and the growth potential of its target markets.
The biggest opportunities for Marvell lie in the rapid growth of data centers, cloud computing, and the adoption of 5G technologies. As these sectors continue to expand, demand for Marvell’s networking solutions, storage devices, and semiconductors is expected to increase. On the other side, the biggest risks include intense competition in the semiconductor industry, technological obsolescence, and potential disruptions in their supply chain, given the complexity and global nature of semiconductor manufacturing.
Earnings are forecasted to grow by 64% per year. But the giant warning sign on $MRVL is that they did not make money over the preceding 12 months. I interpret this as a sign that the stock has benefited from the explosive growth of its competitors in the semiconductor niche.
In this weekly stock study, we will look at and analyze the following indicators and metrics which are our guidelines to dictate our behavior regarding any stock analysis.
- Wall Street Analysts’ Estimates
- 52-week high and low boundaries
- Vantagepoint A.I. Predictive Blue Line
- The Best Case – Worst Case Scenarios
- Neural Network Forecast
- Daily Range Forecast
- Intermarket Analysis
- Our trading suggestion
We don’t base our trading decisions on things like earnings or fundamental cash flow valuations. However, we do look at them to better understand the financial landscape that a company is operating under.
Wall Street Analysts’ Estimates
Based on 25 Wall Street analysts offering 12-month price targets for Marvell in the last 3 months. The average price target is $63.47 with a high forecast of $100.00 and a low forecast of $49.00. The average price target represents a 0.28% change from the last price of $60.29.
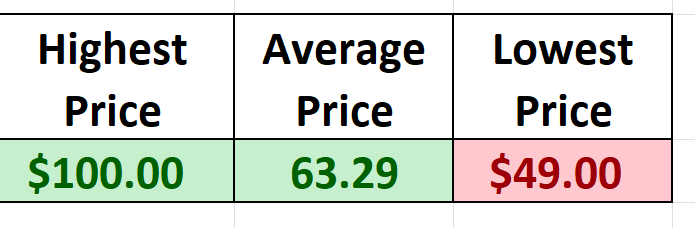
Whenever we see Wall Street estimates this divergent in their opinion it is a sign that we should expect increased volatility in the asset.
We love to see this heavily divergent opinion as it tells us that volatility is baked into the mix.
52-Week High and Low Boundaries
Over the past year we have seen $MRVL trade as low as $33.75 and as high as $67.99. This tells us that the annual trading range is $34.24.
We also like to divide the annual trading range of $34.24 by the most recent close $$60.80 to get a broad-based estimate of trading volatility. This tells us that the volatility of $$MRVL over the past year has been 56.3%. This value also provides us with a basic estimate in letting us know that if the future is like the recent past, it would be normal for $$MRVL to trade in a range that is 56.3% higher and lower than the current price over the next year.
Here is the annual 52-week chart of $MRVL so that you can see the powerful price journey it has taken over the last few weeks.
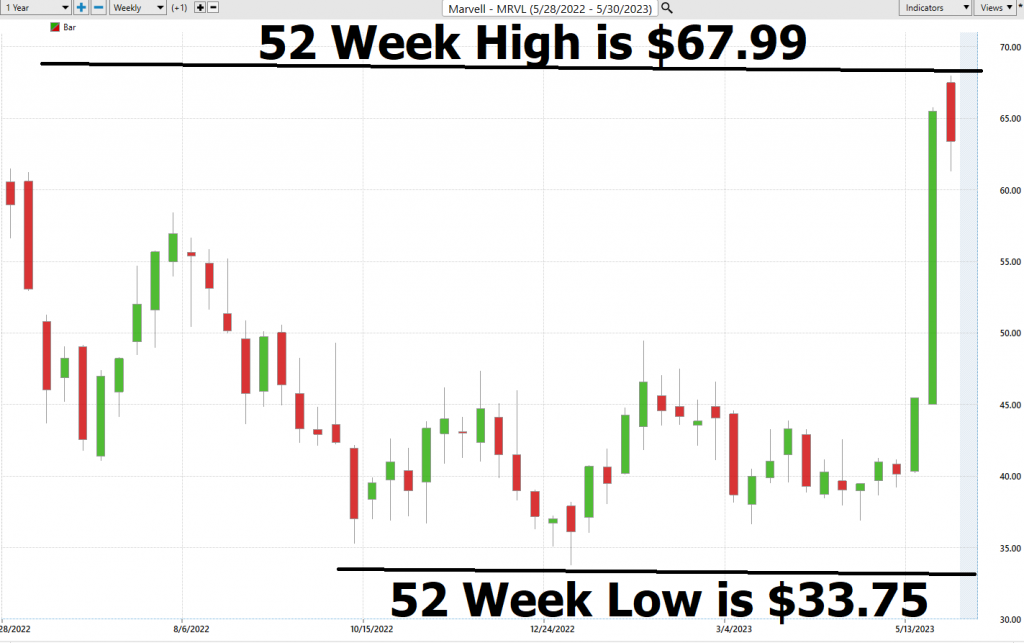
In evaluating the complex landscape of financial markets, astute investors approach the 52-week high and low-price boundaries with a blend of caution and opportunism. These particular markers serve a crucial role in determining a baseline against which current pricing can be compared.
In tandem, these price boundaries function as a barometer for identifying trending versus consolidating assets. $MRVL is currently trading at the 79th percentile of its 52-week range. It recently made a new 52-week high which traders are watching with keen interest.
Power Traders will compare the Wall Street Analysts estimates with these broad volatility estimates to get a broad sense of price action in $$MRVL.
What is also very constructive is to look and examine the longer term 10 year monthly chart for $MRVL.
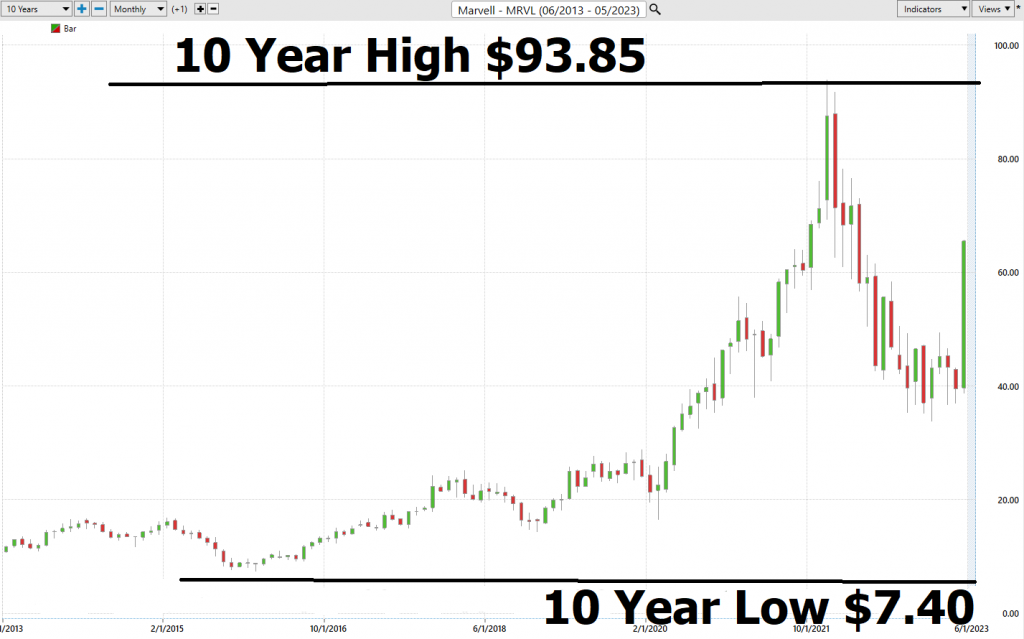
Simply eyeballing the 10-year chart we can clearly see that the most recent month has created the largest trading range in $MRVL’s price history. That confirms our original assessment that volatility should be expected in this asset. Option premiums should also be very high giving seasoned optoion traders the opportunity to exploit volatility.
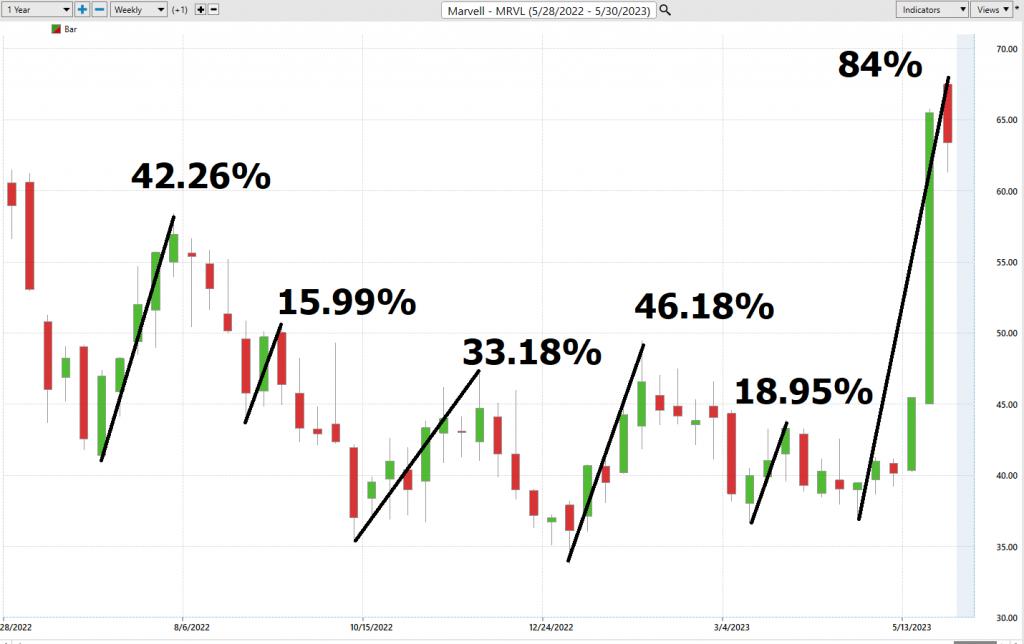
Best Case – Worst Case Scenario $MRVL
Whenever we look at a trade opportunities, to really understand what we are dealing with we need to compare the best rallied to the worst declines to understand the assets real time volatility and then compare the performance of the asset we are considering with the returns of the major market indexes.
Instead of just making this a number, we prefer to look at the charts from a best-case analysis and worst-case analysis. This allows us to get a real assessment of what this volatility means in terms of potential performance.
Great trading is always about being very aware of the potential volatility of an asset. As traders we look for MOTION. But motion is a two-edged sword and by initially looking at rallies and declines we can quickly determine whether an asset is holding on to gains or not. Keep in mind that $MRVL has an annualized volatility of 56.3%. This means that “NORMAL” is defined that the stock could be 56.3% higher or lower over the coming 12 months.
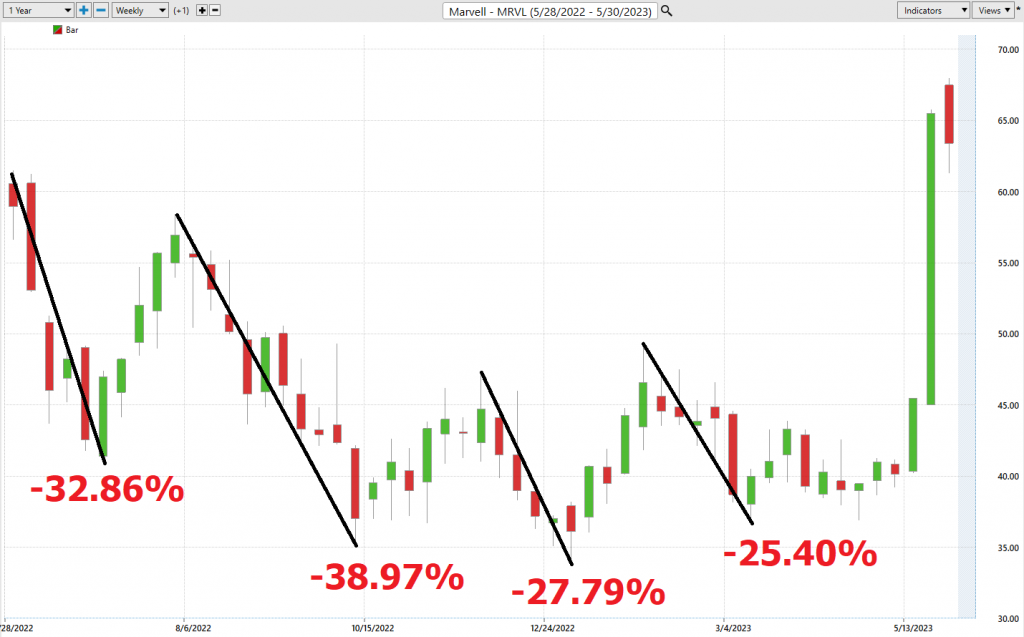
Here is the BEST-CASE analysis.
Followed by the WORST-CASE Analysis:
Next, we compare the performance of $MRVL to the broader major stock market indexes.
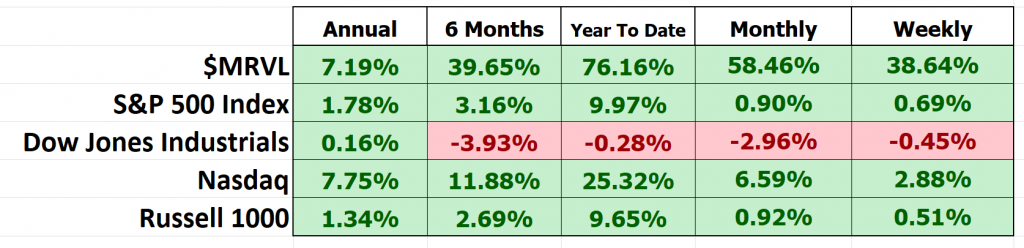
So, we can understand the enthusiasm associated with $MRVL’s recent rally, it has outperformed the broader stock market indexes across all time frames. However, keep in mind that the majority of these gains in $MRVL took place in the last 5 weeks.
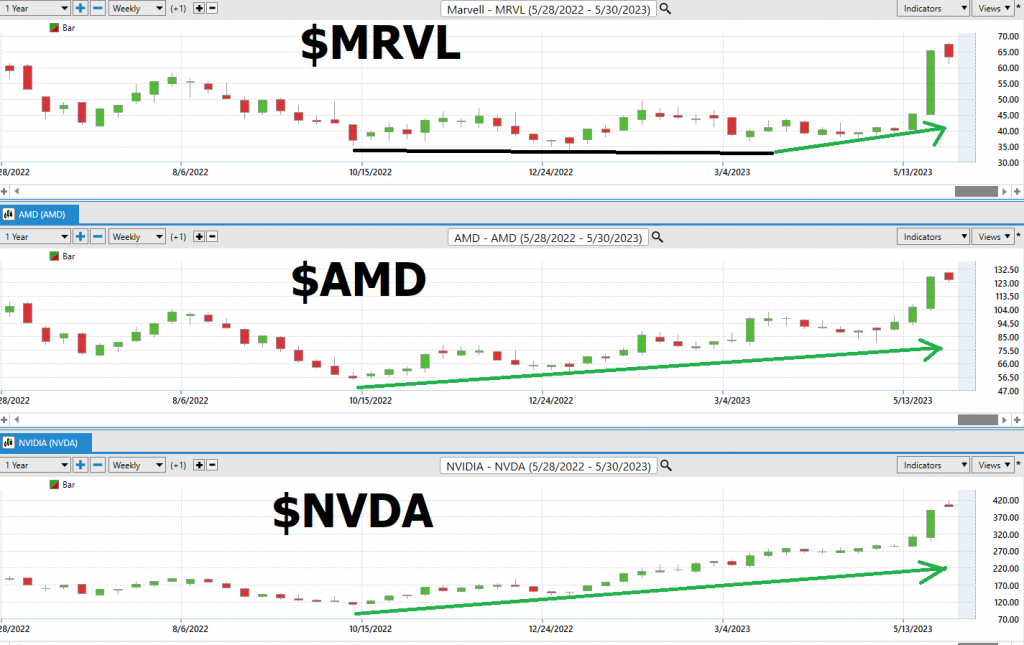
When we drill down a little deeper, we compare $MRVL to the other top semiconductor stocks. We can quickly see that the entire sector has rebounded very nicely.
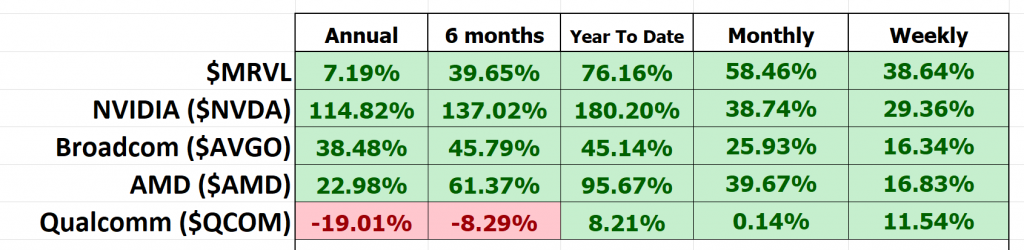
Over the past few months, we have seen huge gains across the entire semiconductor sector. $MRVL has been a beneficiary of this trend but falls far short of the gains seen by $NBVDA, $AVGO and $AMD.
Vantagepoint A.I. Forecast (Predictive Blue Line)
Let’s do some basic trend forecasting analysis based upon the VantagePoint predictive blue line over the last year. On the following chart you will see the power of the VantagePoint Predictive blue line which determines the medium term trend price forecast.
The guidelines we abide by are as follows:
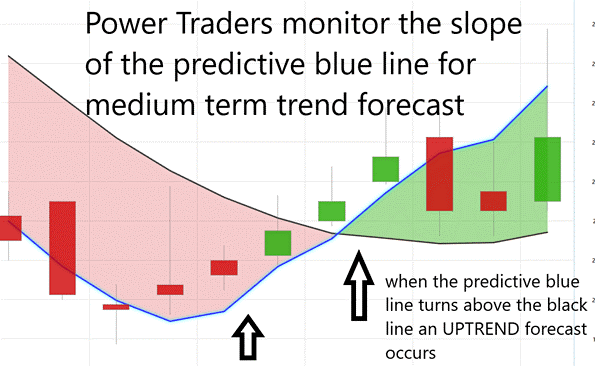
- The slope of the predictive blue line determines the trend and general direction of $MRVL.
- When the blue line turns above the black line an UP opportunity occurs
- When the blue line turns below the black line a DOWN opportunity occurs
- Ideally, the VALUE ZONE is determined to try and buy the asset at or below the predictive blue line.
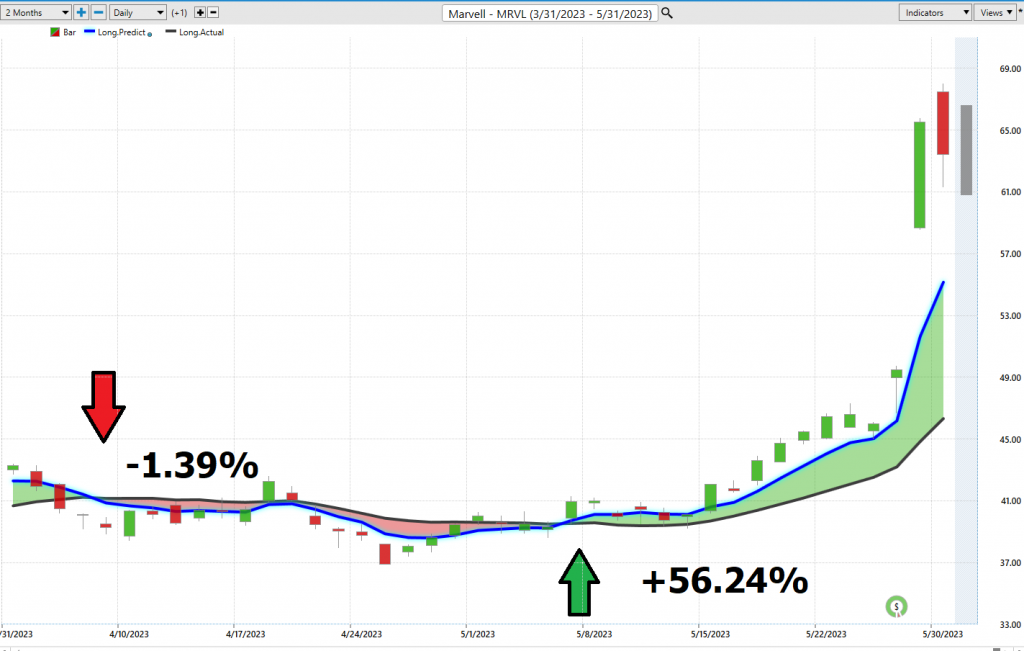
Over the last 2 months, there have been 2 trading opportunities.
Trade #1 generated a negative 1.39% over 22 trading sessions.
Trade #2 generated 56.4% in 17 trading sessions.
This is the power and effectiveness of the Vantagepoint A.I. forecast in assisting traders to stay on the right side of the trend at the right time.
The predictive blue line is the initial indicator which Power Traders use to monitor and navigate the trend.
Next traders cross-reference this signal with the historical pattern recognition available with machine learning and the Neural Index.
Neural Network Indicator (Machine Learning)
At the bottom of the chart is the Neural Index. The Neural Network Indicator is a predictive tool designed to forecast impending short-term market trends. The indicator turns green to signal strength and red to predict a potential market downturn.
A neural network is essentially a computational model inspired by the human brain. It consists of input nodes that receive external information, output nodes that relay information outwards, and hidden nodes that process information internally. The network ‘learns’ by adjusting the weights or influence of connections between nodes.
Central to a Neural Network is its capacity for handling vast quantities of data, transforming it into an expected output. It consistently self-monitors to enhance its performance. These networks, a subtype of artificial intelligence, are instrumental in recognizing patterns within extensive data sets, thereby enabling predictions about future market trends.
In the realm of trading, neural networks are utilized to conduct intricate statistical and probability analyses on historical data, as well as multi-variable analyses of present market conditions. By doing so, they generate highly accurate trading signals. This not only augments traders’ decision-making capabilities but also provides them with a competitive edge.
An example of their utility comes in the form of a DOUBLE confirmation signal, highly sought by Power Traders. This signal emerges when the blue predictive line and the Neural Network Indicator concur on the same anticipated outcome, signifying a statistically reliable trading setup. By identifying such patterns that may otherwise remain hidden, and enhancing forecasting accuracy, neural networks contribute significantly to a trader’s success, saving time, and enhancing profitability.
We advocate that Power Traders cross-reference the chart with the predictive blue line and neural network indicator to create optimal entry and exit points.
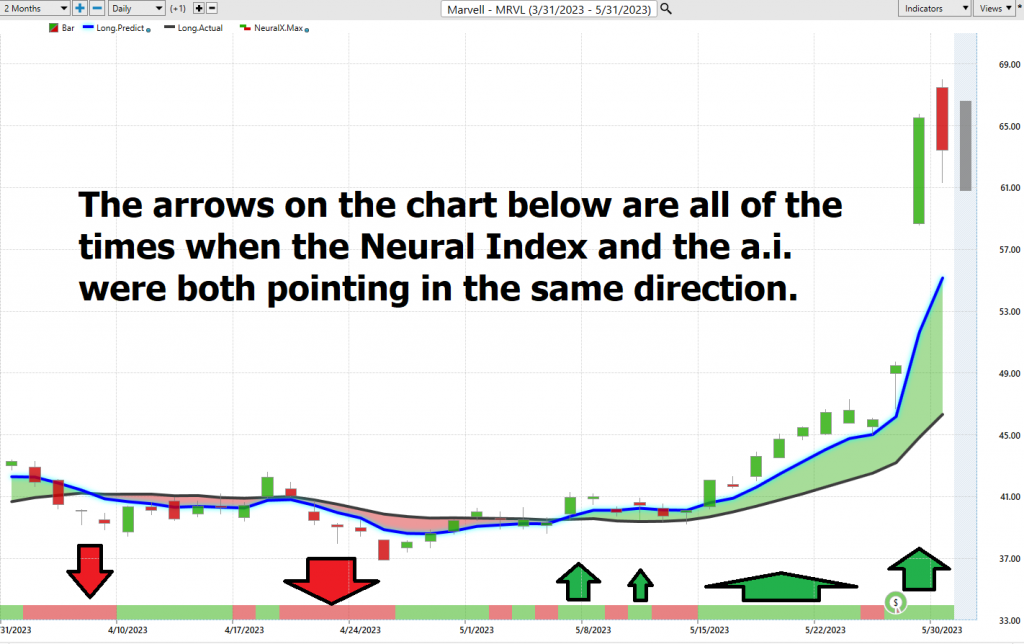
Traders look for confirmation on the Neural Net to position themselves for LONG or SHORT opportunities in the market. In other words, when the A.I. forecast is green, and The Neural Net is green, that presents a buying opportunity.
The inverse is also true, when the A.I. forecast is red and the Neural Net is red, that is a selling opportunity. The arrows on the chart below highlight the trading zones where Power Traders would’ve been using double confirmation to find a buying opportunity in cross-referencing the A.I. forecast with the Neural Net.
Power Traders are always looking to apply both the Neural Network and A.I. to the markets to find statistically sound trading opportunities.
VantagePoint Software Daily Price Range Prediction
One of the powerful features in the VantagePoint Software which Power Traders use daily is the Price Range prediction forecast.
This forecast is what permits Power Traders to truly fine tune their entries and exits into the market.
Every day traders are faced with the anxiety and frustration of wondering where they should be looking for opportunities to buy and sell on the market. VantagePoint’s A.I. makes this decision super easy with the Daily Price Range Forecast. This is where the rubber meets the road.
First off let’s look at the metrics of the trading ranges for $MRVL over the daily, weekly, and monthly time frames.
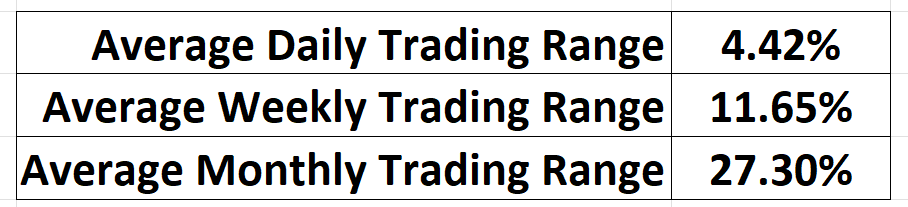
While these are average trading ranges for the times frames indicated you can quickly and easily see how much volatility exists in $MRVL at the present time.
Many factors can affect the daily price range of stocks, from global political events to the weather. As a result, forecasting the daily price range is a complex task that requires careful analysis. There are a number of methods that can be used to forecast daily price ranges, including technical analysis, fundamental analysis, and news-based analysis. Technical analysis involves studying past price movements to identify patterns that may provide clues about future price behavior. Fundamental analysis focuses on economic indicators such as company earnings and interest rates. News-based analysis involves tracking breaking news stories that could have an impact on the stock market. Vantagepoint A.I. uses a proprietary algorithm that combines the power of a.i., neural networks and machine learning to provide a daily price range forecast. By using a combination of these methods, it is possible to develop a more accurate forecast of the daily stock market price range.
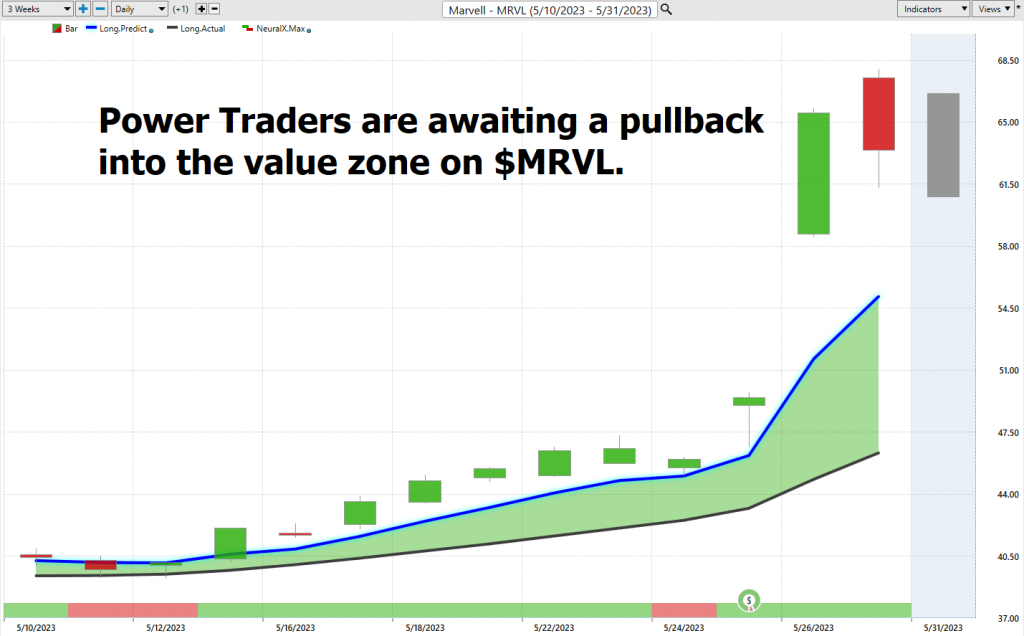
Here is the price chart of $MRVL during the most recent month. The software very clearly delineates the daily forecast by providing an exact lower and upper boundary and specifies the short-term trend.
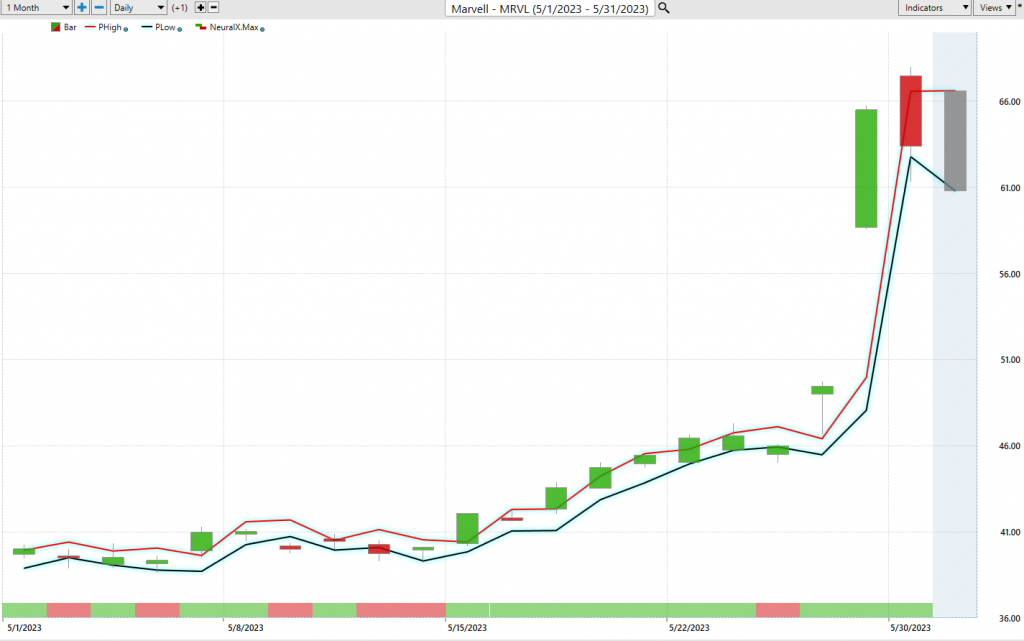
This chart helps traders decide where stop placement should occur. Observe how placing protective sell stops below the dark line on the chart was a powerful way to minimize risk on this trade.
See how the upper and lower bands of the price range forecast for a clear channel of trading activity as well. Swing traders are always looking for opportunities to buy towards the bottom of the predicted channel and selling opportunities above the top band.
Intermarket Analysis
Power lies in the way we respond to the truth we understand.
One of the obvious trends that has unfolded since the beginning of the year is that the semiconductor niche has exploded. At the start of 2023, there were major supply chain disruption concerns.
If we look at the following chart, we can see how $NVDA and $AMD have led the sector significantly higher. $MRVL has been a laggard but certainly has followed suit.
That is a powerful fact that traders use effectively in their decision-making process.
One of the supremely important questions in trading is what is driving the price? Headlines often create interesting narratives. But these “stories” only capture the imagination. Traders want and need to understand the cause and effect of price movement.
The only way to get an answer to this important question is through Intermarket analysis which looks at statistical price correlations of assets and the key drivers of price action.
The following graphic shows you the top 31 drivers of $MRVL’s price action.
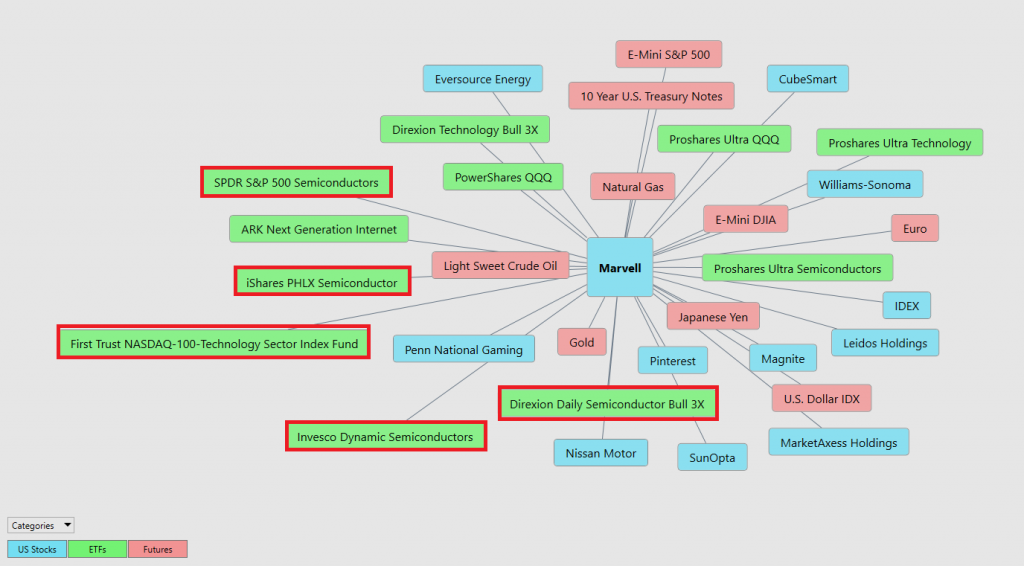
So, a study of the relationship(s) will prove to be beneficial to a trader.
We live in a global marketplace.
Everything is interconnected. Intermarket analysis is the method of analysis used in financial trading that examines the correlations between different asset classes or financial markets. This technique seeks to understand how bonds, commodities, currencies, and equities influence each other. The objective is to gain a more holistic perspective of the broader financial landscape, rather than focusing on a single market in isolation.
Intermarket analysis provides several benefits to traders. First, it helps identify market trends and their relative strength across different asset classes, potentially leading to more robust trading decisions. Second, it helps diversify and manage risk by identifying how movements in one market may affect another. Lastly, it can unveil new trading opportunities that may not be apparent when looking at each market separately.
John Murphy, a pioneer in the field of intermarket analysis and author of “Intermarket Analysis: Profiting from Global Market Relationships”, is one of the most prominent figures who utilizes this approach. Another well-known trader who uses intermarket analysis is Louis B. Mendelsohn, the developer of Vantagepoint software. These and many other traders have used intermarket analysis to enhance their understanding of market dynamics and improve their trading strategies.
Interest rates, Crude Oil Prices, and the volatility of the Dollar amongst thousands of other variables affect the decisions companies must make to flourish and prosper in these challenging times. Trying to determine what these factors are is one of the huge problems facing investors and traders.
You always have a choice. You can tune in to the talking heads in the media who spin talking points which promote fear. Or you can rely on facts to base your decision-making on.
Our Suggestion
We like the price action in $$MRVL. Our expectation is that volatility will increase, and the stock will challenge its 52-week highs. With the volatility increasing in $MRVL the ideal entry point is when the price moves back into the value zone as illustrated by the predictive blue line indicator.
But we think that as long as the a.i. is signaling an uptrend in $$MRVL that we should use these pullbacks to scale in small tradeable positions.
$MRVL saw its share price explode 197% higher over the last five years. And in the last month, the share price has gained an incredible 66%.
PUT $MRVL on your radar and allow the a.i. to guide your trading decisions.
We think it is greatly responsible for the rally we have seen in the broader market.
Practice solid money management on all your trades.
We will re-evaluate based upon:
- New Wall Street Analysts’ Estimates
- New 52-week high and low boundaries
- Vantagepoint A.I. Forecast (Predictive Blue Line)
- Neural Network Forecast
- Daily Range Forecast
Let’s Be Careful Out There!
It’s Not Magic.
It’s Machine Learning.

IMPORTANT NOTICE!
THERE IS SUBSTANTIAL RISK OF LOSS ASSOCIATED WITH TRADING. ONLY RISK CAPITAL SHOULD BE USED TO TRADE. TRADING STOCKS, FUTURES, OPTIONS, FOREX, AND ETFs IS NOT SUITABLE FOR EVERYONE.
DISCLAIMER: STOCKS, FUTURES, OPTIONS, ETFs AND CURRENCY TRADING ALL HAVE LARGE POTENTIAL REWARDS, BUT THEY ALSO HAVE LARGE POTENTIAL RISK. YOU MUST BE AWARE OF THE RISKS AND BE WILLING TO ACCEPT THEM IN ORDER TO INVEST IN THESE MARKETS. DON’T TRADE WITH MONEY YOU CAN’T AFFORD TO LOSE. THIS ARTICLE AND WEBSITE IS NEITHER A SOLICITATION NOR AN OFFER TO BUY/SELL FUTURES, OPTIONS, STOCKS, OR CURRENCIES. NO REPRESENTATION IS BEING MADE THAT ANY ACCOUNT WILL OR IS LIKELY TO ACHIEVE PROFITS OR LOSSES SIMILAR TO THOSE DISCUSSED ON THIS ARTICLE OR WEBSITE. THE PAST PERFORMANCE OF ANY TRADING SYSTEM OR METHODOLOGY IS NOT NECESSARILY INDICATIVE OF FUTURE RESULTS. CFTC RULE 4.41 – HYPOTHETICAL OR SIMULATED PERFORMANCE RESULTS HAVE CERTAIN LIMITATIONS. UNLIKE AN ACTUAL PERFORMANCE RECORD, SIMULATED RESULTS DO NOT REPRESENT ACTUAL TRADING. ALSO, SINCE THE TRADES HAVE NOT BEEN EXECUTED, THE RESULTS MAY HAVE UNDER-OR-OVER COMPENSATED FOR THE IMPACT, IF ANY, OF CERTAIN MARKET FACTORS, SUCH AS LACK OF LIQUIDITY. SIMULATED TRADING PROGRAMS IN GENERAL ARE ALSO SUBJECT TO THE FACT THAT THEY ARE DESIGNED WITH THE BENEFIT OF HINDSIGHT. NO REPRESENTATION IS BEING MADE THAT ANY ACCOUNT WILL OR IS LIKELY TO ACHIEVE PROFIT OR LOSSES SIMILAR TO THOSE SHOWN.

