
![]()
Acadia Pharmaceuticals is a biopharmaceutical company that primarily focuses on the discovery, development, and commercialization of small molecule drugs that address unmet medical needs in central nervous system disorders. A central nervous system disorder is a condition that affects the brain and/or spinal cord. Among the most prominent central nervous system disorders are Alzheimer’s Disease, Parkinson’s’ Disease, Multiple Sclerosis, Stroke, Epilepsy, Brain Tumors, Dementia and Schizophrenia.
$ACAD’s major product is Nuplazid (pimavanserin), approved in the US for the treatment of hallucinations and delusions associated with Parkinson’s disease psychosis. Recently the FDA approved $ACAD’s Daybe (trofinetide) which is the first and only drug for treating Rett syndrome which is a rare genetic disorder that causes a progressive loss of motor skills and language.
Acadia generates revenue primarily from the sale of their approved drugs. This includes both direct sales to consumers and sales to various healthcare and pharmaceutical providers or organizations. The company may also earn revenue from strategic partnerships, licensing agreements, and collaborations with other pharmaceutical or biotech companies.
The company was founded in 1993. They have about 500 employees.
Some direct competitors include Neurocrine Biosciences, Intra-Cellular Therapies, and Sunovion Pharmaceuticals, among others. The competitive landscape, changes rapidly in the biopharmaceutical industry based upon regulatory challenges, funding and regulatory approvals.
In terms of opportunities, Acadia operates in a highly specialized market segment that focuses on unmet medical needs. This could provide significant opportunities as there may be limited competition and a high demand for effective treatments. Their focus on small molecule drugs for central nervous system disorders allows them to potentially address a variety of conditions with high unmet medical needs.
On the other hand, Acadia faces several risks common to the pharmaceutical and biotechnology industry. The development and commercialization of new drugs is a costly and time-consuming process with no guaranteed success. Clinical trials can fail, or regulatory bodies such as the FDA may not approve a drug. Even after approval, drugs are subject to ongoing regulatory scrutiny. Additionally, Acadia also faces the risk of competition from other firms developing similar treatments, and the risk of patent expiration, after which generic versions of their drugs can be produced by other companies. Lastly, pricing pressures from healthcare payers and potential changes in healthcare laws and regulations can also impact the company’s profitability.
Earnings on $ACAD have grown by 6.4% per year over the past 5 years. Earnings are expected to grow at 72.11% over the coming year.
In this stock study we will look at the following metrics and indicators.
- Wall Street Analysts’ Estimates
- 52-week high and low boundaries
- Best Case – Worst Case Analysis
- Vantagepoint A.I. Forecast (Predictive Blue Line)
- Neural Network Forecast
- Daily Range Forecast
- Intermarket Analysis
- Our trading suggestion
We don’t base our decisions on things like earnings or fundamental cash flow valuations. However, we do look at them to better understand the financial landscape that a company is operating under.
Analysts Ratings
In our thorough examination of the stock, our first course of action is to understand the perspectives of seasoned professionals who have dedicated their careers to monitoring this asset. We can gain insights into these experts’ views by examining the target price ranges they’ve set for $ACAD. This allows us to gain a firm understanding of their perceived overvalued, fairly valued, and undervalued price points.
The 18 analysts offering 12-month price forecasts for ACADIA Pharmaceuticals Inc have a median target of 22.30, with a high estimate of $33.00 and a low estimate of $12.00. The median estimate represents a -7.43% decrease from the last price of $24.09.
From this simple analysis we can see that $ACAD is slightly overvalued at the present time but some on Wall Street think that it has the potential to run another $8.84.
52-week High-Low Chart
In a conservative context, a 52-week high marks the uppermost price level at which a stock has been traded during the past year. Correspondingly, a 52-week low signifies the lowest trading point reached within the same period. Therefore, when a stock registers a 52-week high, it suggests a positive trend, while hitting a 52-week low implies a negative trend.
Why does a 52-week high hold importance?
When a stock reaches its 52-week zenith, it prompts investor attention owing to its commendable performance. This holds true when the stock touches a 52-week nadir as well. Such benchmarks serve as essential analytical tools for traders.
As traders, it is vital to undertake a detailed evaluation of a stock’s performance, which entails scrutiny of the charts and determining the asset’s standing in relation to its 52-week highs. This is a significant stage in the analysis—it distinguishes robust from the underperforming. Contrary to common perceptions, stocks with superior performance often set new 52-week highs consistently. This suggests market confidence in their potential, with investors demonstrating a positive outlook on their prospects.
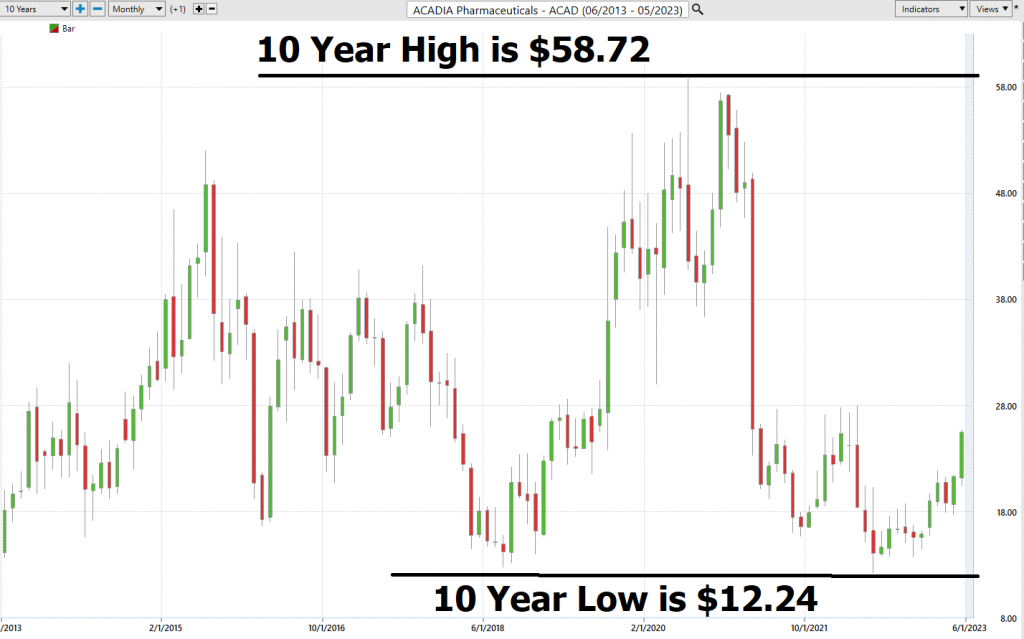
One of the most straightforward and effective approaches to gauge a stock’s path is to review long-term monthly and weekly charts. By adopting a broader perspective and analyzing a stock’s overall trend, traders can discern patterns and obtain meaningful insights into its trajectory. Numerous successful traders around the globe utilize long-term monthly charts to guide their trend analysis, acknowledging that it offers a holistic picture of a stock’s performance and enables them to make well-informed decisions based on a variety of factors.
Over the last 52 weeks $ACAD has traded as high as $25.73 and as low as $12.24. It’s currently trading at its 98th percentile of its 52-week trading range.
We also like to divide the annual range ($13.49) by the current price ($25.40) to provide us with a broad estimate of volatility. Currently, the statistical volatility is 53.1%. This metric tells us that if the future behaves like the recent past it would have a very high probability for $ACAD over the next year, to be trading in a range that is 53.1% higher and lower from where it is right now.
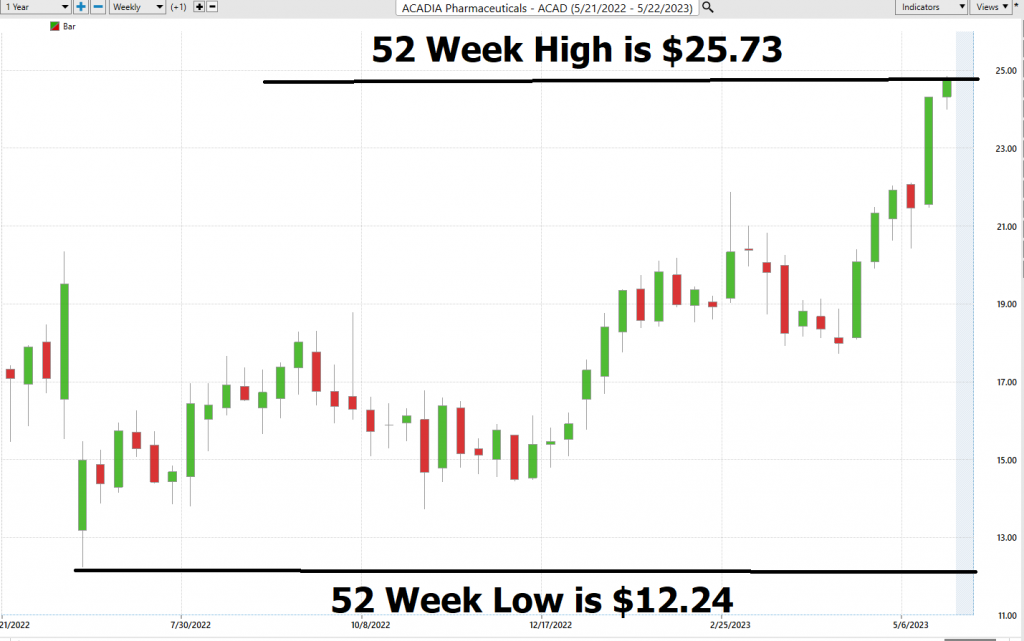
As savvy traders, we always keep a keen eye on our position within the 52-week trading range. It is a well-known fact that the 52-week high can often present a formidable hurdle for the market, until it is surpassed. In fact, it is not uncommon for stocks to experience a rapid and substantial surge in price shortly after breaching this critical threshold.
Stocks that repeatedly break through their 52-week highs multiple times within a given year tend to be in a robust trend and are therefore of great interest to us. The 52-week mark frequently acts as a significant resistance level that can thwart momentum, requiring us to stay laser-focused on the signals generated by our artificial intelligence forecasts.
What is potentially very promising about the recent rally in $ACAD is how much potential it has to even revert to its median price of the past decade. The stock was decimated in 2020 and has spent the last 28 months consolidating.
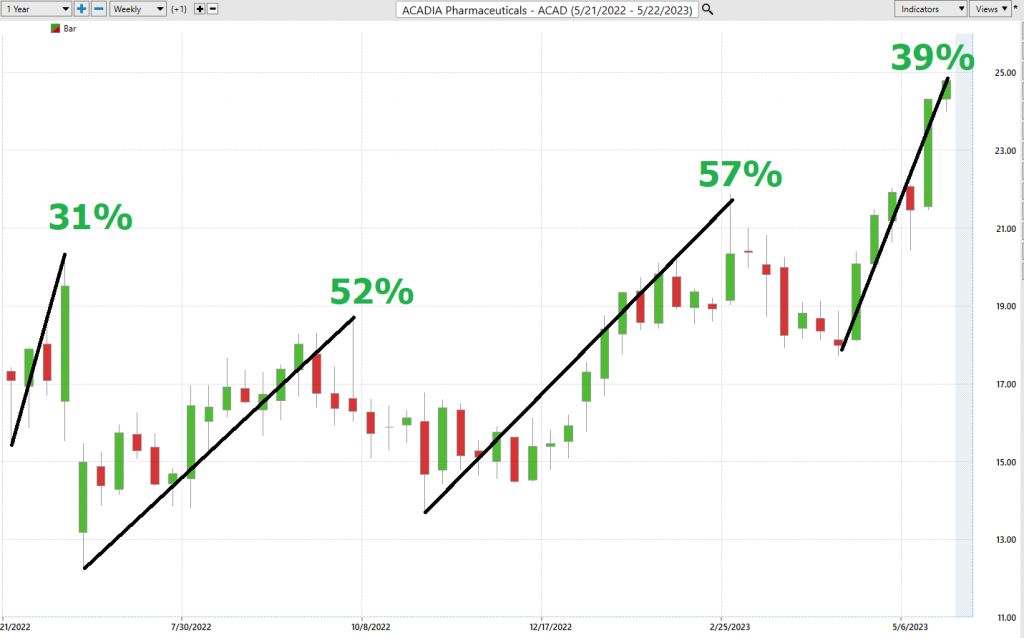
Best Case – Worst Case Analysis
Moving forward, our intent is to get a real-world perspective of risk and volatility. We can accomplish this by looking at the practical realm of performance and outcomes. We deem it crucial, prior to initiating any trade, to have a comprehensive understanding of how the past year’s rallies compare to the declines. This exercise offers us a glimpse into the actual price movements of $ACAD, aiding us in comprehending its volatility.
To realize this goal, we merely link the highest and lowest points to simply understand how the rallies have compared to the declines.
First the best-case analysis:
Followed by the worst-case analysis:
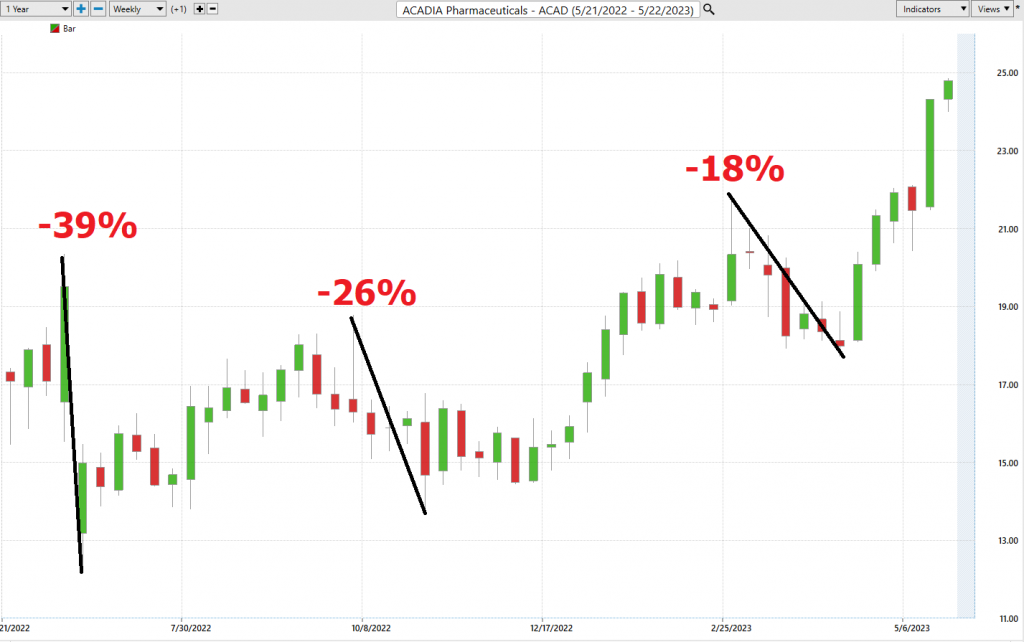
You can quickly observe the level of risk and opportunity by doing this analysis on your own any time you trade.
Lastly, we compare the performance of $ACAD to the broader stock market indexes.
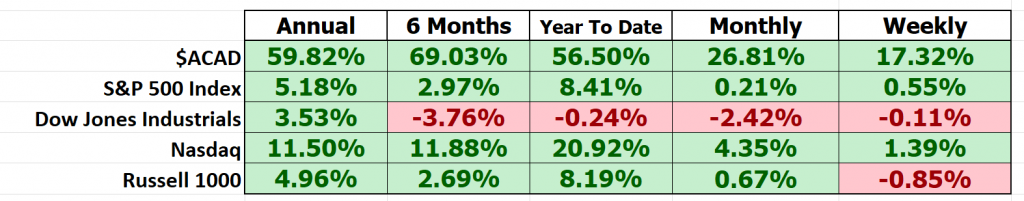
Clearly, $ACAD massively outperformed the broader stock market indexes across all major important time frames. So, we can conclude that $ACAD deserves to be on your trading radar.
Vantagepoint A.I. Forecast (Predictive Blue Line)
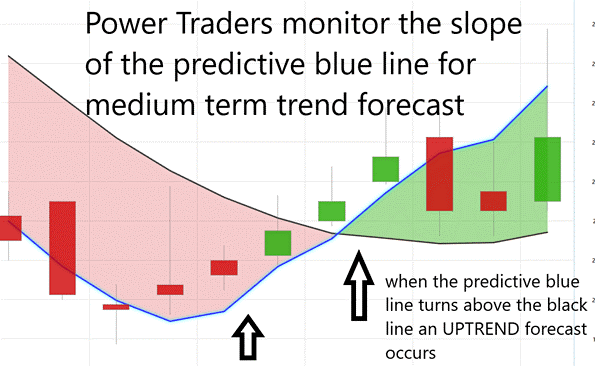
Using VantagePoint Software and the artificial intelligence, traders are alerted to trend forecasts by monitoring the slope of the predictive blue line. The black line is a simple 10-day moving average of prices which simply tells you what has occurred in the market. The predictive blue line also acts as a value zone where in uptrends traders try to purchase the asset at or below the blue line.
When studying the chart below, it’s imperative to consider the interplay between the black line and the predictive blue line. The black line simply provides a historical perspective. It informs you about the past price points and the average price over the previous ten days.
Contrastingly, the predictive blue line, backed by Vantagepoint’s proprietary Neural Network and Intermarket Analysis, predicts future values and trends. It harnesses artificial intelligence and employs statistical correlations to identify the most potent price influencers of an asset.
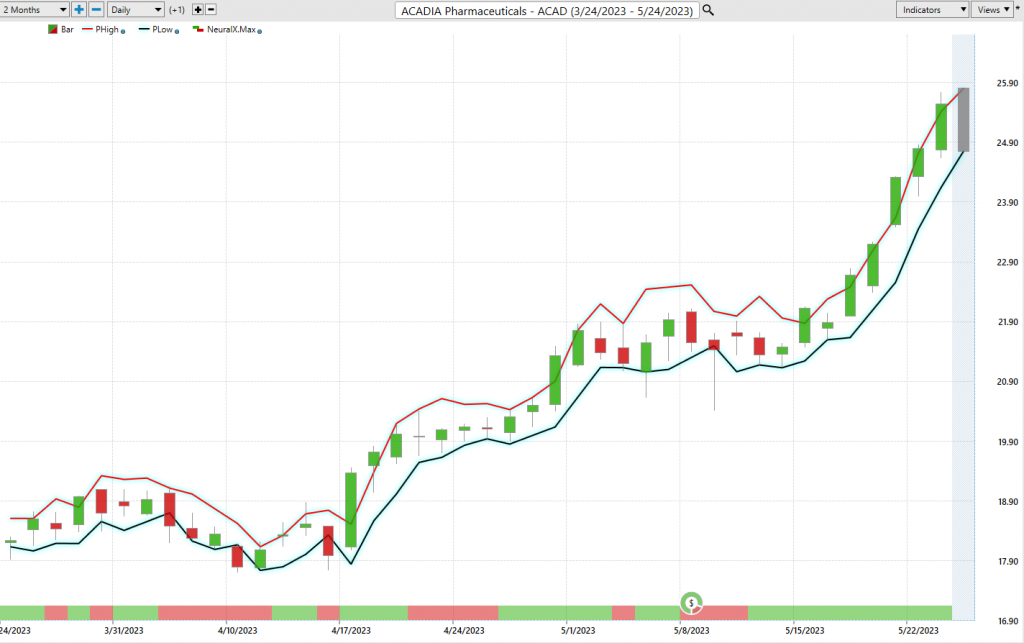
Our focus will be on the past six weeks of $ACAD stock, providing an opportunity for you to witness firsthand the remarkable capabilities of artificial intelligence in a live trading scenario. While our approach is conservative, we believe that such technological advancements provide an exciting window into trend analysis and risk management.
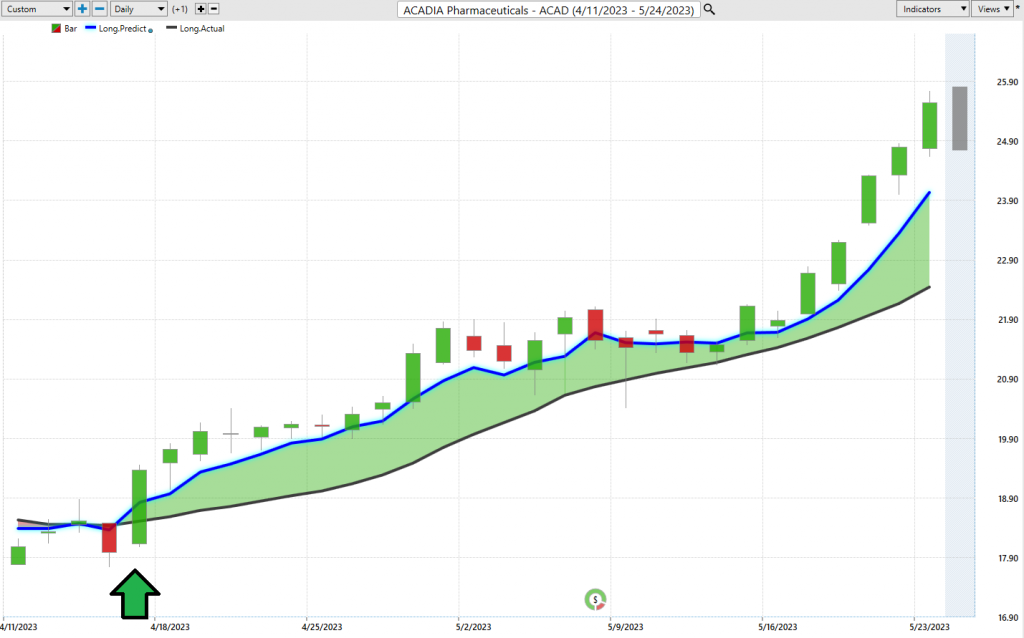
Whenever we see the predictive blue line move above the black line, we are presented with an UP-forecast entry opportunity. These are highlighted by the UP arrow on the chart.
Whenever the predictive blue line moves below the black line, we are presented with a DOWN forecast entry opportunity. More importantly, there is no guesswork involved. Traders know where the value zone and trend are at all times.
Over the last 27 trading sessions the a.i. forecast effectively navigated the uptrend in $ACAD and caught a 31.7% move.
Fine Tuning Entries with The Neural Net Indicator
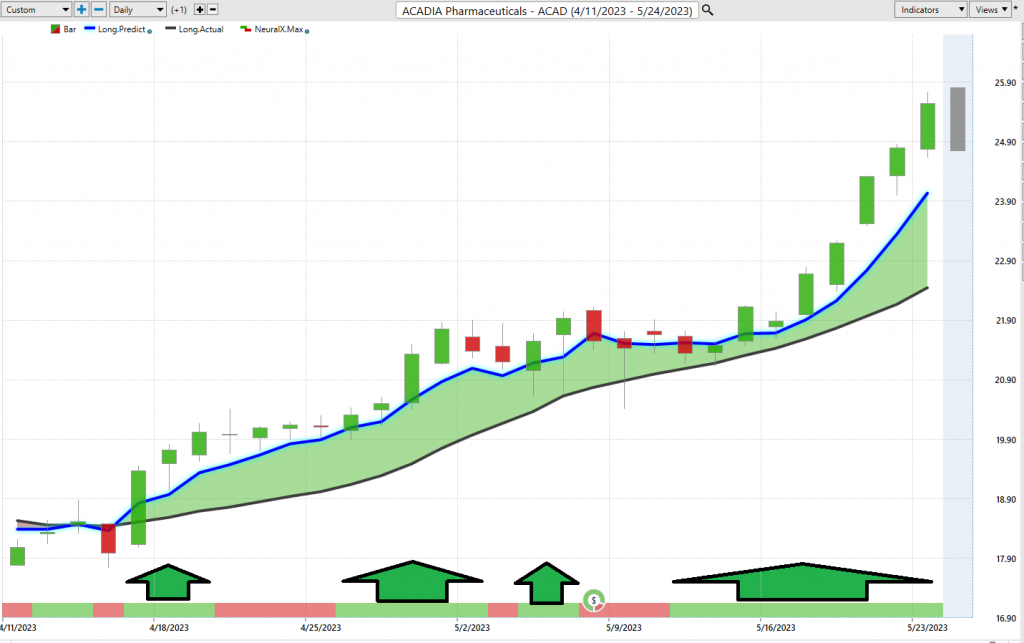
The Neural Index Indicator is a phenomenal tool that equips traders with the capacity to forecast potential market strength or weakness! When the indicator shines green, all systems go, signaling strength, while a red light suggests some short-term turbulence ahead. We enthusiastically urge Power Traders to pair this ingenious tool with the predictive blue line, fine-tuning their entry and exit strategies to the max!
A Neural network is a cutting-edge computational network that employs a massive amount of computational ability and functions to sift through a mountain of data and generate the best move forward. It’s like a watchful guardian, ceaselessly self-evaluating and boosting its performance, making it an invaluable ally as a trading partner.
Power Traders, with their keen eyes always peeled for statistically solid trading prospects, leverage both the neural network and artificial intelligence to spot those winning trades. They cleverly utilize a “double confirmation” strategy where the predictive blue line and Neural Net align—setting up the stage for optimizing the odds of a successful trade. The arrows on the chart above are all of the instances when the neural index and the a.i. were both pointing in the same direction at the same time.
Our advice to Power Traders is to keep a laser-sharp focus on the slope of the predictive blue line and its alignment with the Neural Index. Look at the chart above! Notice how the Neural Net served up numerous juicy double confirmation opportunities. These instances where the predictive blue line and Neural Net teamed up, forecasted the same trend, laying out a scenario of high-probability trading opportunities ripe for the taking.
By staying in sync with the Neural Network Indicator and harnessing the power of the predictive blue line, Power Traders can stay a step ahead, always ready to spot those potentially lucrative trading opportunities.
VantagePoint Software Daily Price Range Prediction
One of the powerful features in the Vantagepoint A.I. Software which Power Traders use daily is the Daily Price Range prediction forecast.
This forecast is what permits Power Traders to truly fine tune their entries and exits into the market.
Over the past year here are the average trading ranges for the monthly, weekly, and daily time frames.
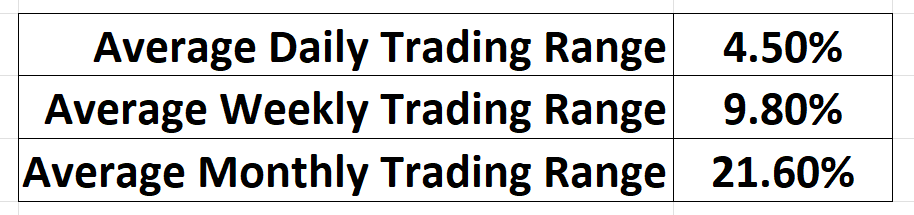
Amidst this level of volatility, there is either tremendous opportunity or risk. It will always depend upon where the trader decides to place their entries and exits.
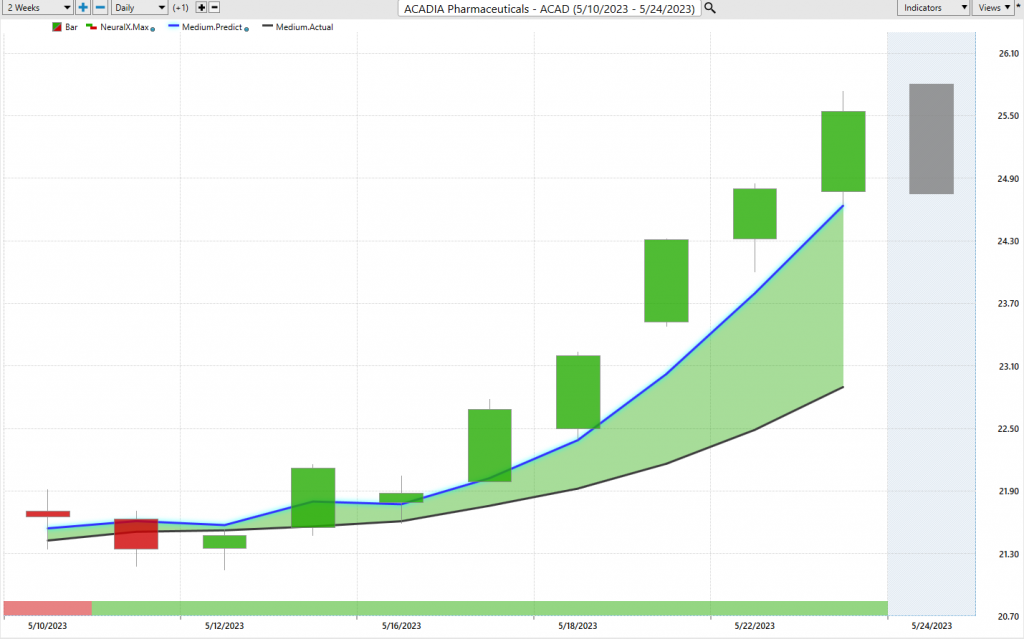
Here is the price chart of $ACAD during the most recent 6-week runup featuring the Daily Price Range forecast and the Neural Net Indicator. Observe how the trend is always very clearly delineated. Traders use the predicted high and low prices as guides in their overall trading strategy.
Intermarket Analysis
The Vantagepoint Software is gaining attention among traders for its unique ability to conduct Intermarket analysis and identify the assets that have the strongest statistical correlations and serve as key drivers of prices. While chart analysis can offer insights into locating support and resistance levels, the global marketplace demands a more comprehensive approach, considering how everything is interconnected. Thus, the billion-dollar question for traders remains: what are the key drivers of price for the underlying asset they are trading? These intangibles are invisible to the naked eye, but they exhibit high statistical correlations.
Intermarket analysis is a method of evaluating markets by examining the correlations between different asset classes. This type of analysis expands on traditional single-market analysis (like stock or forex analysis) by considering the influence of other asset markets as well.
The premise behind intermarket analysis is that all markets — stocks, bonds, commodities, and currencies, among others — are interconnected and that these connections are significant to the overall market movements. For example, an increase in the interest rate (bond market) could drive investors towards bonds and away from equities (stock market), causing stocks to fall.
John Murphy, a former CNBC correspondent, is perhaps the most prominent proponent of intermarket analysis. He is widely recognized for his work and has authored several books on the topic, including “Intermarket Analysis: Profiting from Global Market Relationships”. He argues that no market operates in isolation, and thus, traders must consider global market relationships to make informed decisions. Vantagepoint A.I. founder, Lou Mendelsohn, has been an active and vocal proponent of Intermarket Analysis for decades.
Intermarket analysis can help traders make better decisions by providing a more holistic view of the market. Rather than examining a single market in isolation, intermarket analysis considers the movement of multiple interconnected markets. This can lead to more accurate predictions about future market movements and trends.
For instance, consider the often-observed correlation between the U.S. Dollar and commodities prices, which typically move in opposite directions. If intermarket analysis indicates a potential rise in the U.S. Dollar, a trader might anticipate commodities prices to fall.
Furthermore, understanding these relationships allows traders to manage risk more effectively. If one asset class is expected to decline, a trader can offset potential losses by investing in another asset that is expected to rise.
It’s important to note that while intermarket analysis can be immensely helpful, it should be used in conjunction with other forms of analysis to confirm signals and predictions, not as a standalone tool.
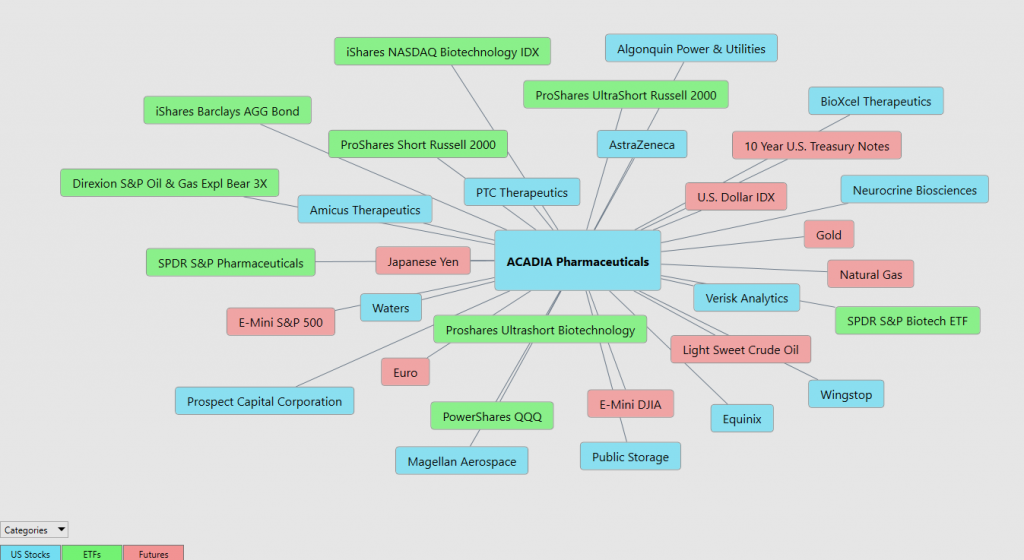
Fluctuations in interest rates, crude oil prices, and the volatility of the dollar, among other variables, have a profound impact on business decisions in these challenging times. Investors and traders alike face the daunting task of identifying these factors. The key drivers of $ACAD price movement, for instance, hold great value for traders, as it can reveal the ETFs most likely to acquire $ACAD and other industries that impact its price movement.
Suggestion
$ACAD has had an incredible run over the past year. It deserves to be on your radar.
As we have shown it has outperformed the broader stock market indexes. It has also outperformed its competitors.
This asset could go much higher but at the present time we would expect the stock to revert to a few % points below the value zone identified by the predictive blue line.
The trend is UP.
Momentum is UP.
We like that it has massively outperformed the broader market across all time frames. Clearly, this stock should be on your trading radar.
The predictive blue line is the guidance that we will be following. Wall Street Analysts are slowly revising their estimates upward.
Our advice: Follow the a.i. trend analysis and practice good money management on all your trades. The chart looks strong on $ACAD particularly since it has made new 10-year highs. We will be looking at short-term swing trading opportunities on the long side. We expect the pullback to be brief.
We will re-evaluate this analysis based upon:
- Wall Street Analysts’ Estimates
- 52-week high and low boundaries
- Vantagepoint A.I. Forecast (Predictive Blue Line)
- Neural Network Forecast
- Daily Range Forecast
- Intermarket Analysis
Let’s Be Careful Out There!
It’s Not Magic.
It’s Machine Learning.

IMPORTANT NOTICE!
THERE IS SUBSTANTIAL RISK OF LOSS ASSOCIATED WITH TRADING. ONLY RISK CAPITAL SHOULD BE USED TO TRADE. TRADING STOCKS, FUTURES, OPTIONS, FOREX, AND ETFs IS NOT SUITABLE FOR EVERYONE.
DISCLAIMER: STOCKS, FUTURES, OPTIONS, ETFs AND CURRENCY TRADING ALL HAVE LARGE POTENTIAL REWARDS, BUT THEY ALSO HAVE LARGE POTENTIAL RISK. YOU MUST BE AWARE OF THE RISKS AND BE WILLING TO ACCEPT THEM IN ORDER TO INVEST IN THESE MARKETS. DON’T TRADE WITH MONEY YOU CAN’T AFFORD TO LOSE. THIS ARTICLE AND WEBSITE IS NEITHER A SOLICITATION NOR AN OFFER TO BUY/SELL FUTURES, OPTIONS, STOCKS, OR CURRENCIES. NO REPRESENTATION IS BEING MADE THAT ANY ACCOUNT WILL OR IS LIKELY TO ACHIEVE PROFITS OR LOSSES SIMILAR TO THOSE DISCUSSED ON THIS ARTICLE OR WEBSITE. THE PAST PERFORMANCE OF ANY TRADING SYSTEM OR METHODOLOGY IS NOT NECESSARILY INDICATIVE OF FUTURE RESULTS. CFTC RULE 4.41 – HYPOTHETICAL OR SIMULATED PERFORMANCE RESULTS HAVE CERTAIN LIMITATIONS. UNLIKE AN ACTUAL PERFORMANCE RECORD, SIMULATED RESULTS DO NOT REPRESENT ACTUAL TRADING. ALSO, SINCE THE TRADES HAVE NOT BEEN EXECUTED, THE RESULTS MAY HAVE UNDER-OR-OVER COMPENSATED FOR THE IMPACT, IF ANY, OF CERTAIN MARKET FACTORS, SUCH AS LACK OF LIQUIDITY. SIMULATED TRADING PROGRAMS IN GENERAL ARE ALSO SUBJECT TO THE FACT THAT THEY ARE DESIGNED WITH THE BENEFIT OF HINDSIGHT. NO REPRESENTATION IS BEING MADE THAT ANY ACCOUNT WILL OR IS LIKELY TO ACHIEVE PROFIT OR LOSSES SIMILAR TO THOSE SHOWN.

