
When Elon Musk acquired TESLA in 2010, it marked the start of an incredible journey for both the company and Musk himself. At the time, Tesla had a variety of strategic advantages that attracted Musk and prompted him to purchase the company for $2.6 billion. Aside from the fact that he believed strongly in Tesla’s innovative approach to green energy, he saw potential in Tesla’s automotive platform after testing prototypes several months prior. Ultimately, this purchase was an incredible opportunity to create change through these alternative means as opposed to waiting for reactionary steps to be taken by government regulation. Today the company has a market cap of $693.47 billion and is the largest automaker in the world.
Tesla is taking an unexplored turn into the advertising realm with the hopes that promotion will help increase TESLA sales. This move by the iconic promoter is raising eyebrows and stirring curiosity among investors. It’s crucial to understand whether this move signifies a decrease in product demand or is merely an attempt to rectify misconceptions about Tesla’s product prices. This decision, as cryptic as it seems, could either ring alarm bells or herald more growth opportunities for the company.
Despite fears of an impending slowdown, the bullish sentiment around Tesla hasn’t left the stage yet. However, any signs of falling sales post-advertising could trigger a retreat among some investors, fearing Tesla might revert to conventional automaker tactics. But many believe that $TSLA’s modest foray into advertising will only strengthen Tesla’s market position, thanks to Elon Musk’s proven business acumen and keen marketing tactics.
Tesla’s price reductions amid the challenging economic environment and rising competition might ruffle some feathers, but remember, these moves are a crucial steppingstone for Tesla’s evolution from a niche player to a mass-market leader in the burgeoning EV industry.
Lastly, Tesla’s potential in leveraging AI technology, especially in autonomous driving, shouldn’t be understated. It has a clear edge in terms of data collection and has ambitious plans to offer a free trial of its full self-driving capability, enabling Tesla to stay ahead of the curve.
In short, the road ahead for Tesla may be peppered with challenges, but with strategic price adjustments, ambitious growth strategies, and a venture into advertising, the future looks promising.
Musk currently owns approximately 20% of TESLA and continues to calculate potential risk-reward scenarios as he pushes toward further innovation within the industry.
Elon Musk’s entrepreneurial journey is nothing short of extraordinary, and his successes are noteworthy. As a multi-billionaire tech mogul, Musk has been a driving force in several groundbreaking industries. He co-founded PayPal, which revolutionized digital payments and was sold to eBay for a staggering $1.5 billion. He also founded SpaceX, which is changing the way we approach space travel and has achieved historical milestones, such as launching the first privately funded spacecraft (Dragon) to dock at the International Space Station. Musk’s leadership at Tesla Inc. has led to a transformation in the automotive industry, pushing electric vehicles into the mainstream, all while challenging the traditional dealership sales model.
However, Musk’s career hasn’t been without its challenges and controversies. His management style, characterized by a relentless work ethic and ambitious deadlines, has often been criticized for fostering a high-pressure work environment. His habit of making bold and sometimes controversial statements on social media has also gotten him into hot water, leading to legal troubles and causing significant fluctuations in Tesla’s stock price. There have been production issues and delivery delays at Tesla, and several deadly crashes have raised safety concerns about the company’s Autopilot system. Despite these challenges, Musk’s audacity and vision continue to inspire innovation, while his unconventional approach keeps him in the global spotlight.
Analysts believe that earnings are expected to grow by 19.6% per year moving forward.
Over the past year earnings grew by 40.4%
In the competitive sphere of the electric vehicle (EV) market, Tesla holds considerable sway despite robust competition from other industry giants. Estimates place Tesla’s market share around the 20-25% mark, with formidable contenders like Audi, BMW, Mercedes, and Kia Motors steadily gaining ground. With rapid advancements in technology, Tesla’s rivals are vigorously striving to close the gap and potentially eclipse their competition. EV technology continues to improve in accessibility and affordability, thereby increasing consumer choices across various price ranges. Despite this stiff competition, Tesla maintains its leadership due to consistent innovation and an unwavering commitment to product quality.
Tesla’s determination to revolutionize the automotive industry brings forth significant challenges. Foremost among these is the high cost associated with research and development, necessitating efficient financial management. Also, Tesla faces the daunting task of competing against long-established markets that have proven successful over extended periods, necessitating continual innovation. Moreover, mainstream acceptance of their products necessitates extensive and brand-appropriate marketing strategies. The path ahead for Tesla is both challenging and exhilarating as it aims to reshape the automotive landscape.
However, Tesla’s journey hasn’t been without its obstacles; it was among the worst-performing stocks of 2022. But on a positive note, Tesla optimism is fueled by their expansion initiatives, which include opening two new gigafactories in Berlin, Germany, and Austin, Texas. These ventures aim to boost their production capacity to 2 million electric vehicles annually. Analysts predict that Tesla’s revenue growth will breach the $100 billion mark for the first time in the company’s history.
Tesla has proven to be an incredible investment opportunity over the past decade. However, it faces huge risks at present. Among them are production and scaling challenges, a dependency on government incentives along with numerous regulatory and compliance challenges which could curtail its ability to effectively expand into numerous markets. Tesla’s next earnings call is scheduled for July 23, 2023, and will be a key driver of price for the remainder of 2023.
In this weekly stock study, we will look at and analyze the following indicators and metrics as are our guidelines which dictate our behavior in deciding whether to buy, sell, or stand aside on a particular stock.
- Wall Street Analysts’ Estimates
- 52-week high and low boundaries
- Best Case – Worst Case Analysis and Takeaways
- Vantagepoint A.I. Forecast (Predictive Blue Line)
- Neural Network Forecast
- Daily Range Forecast
- Intermarket Analysis
- Our trading suggestion
We don’t base our trading decisions on things like earnings or fundamental cash flow valuations. However, we do look at them to better understand the financial landscape that a company is operating under.
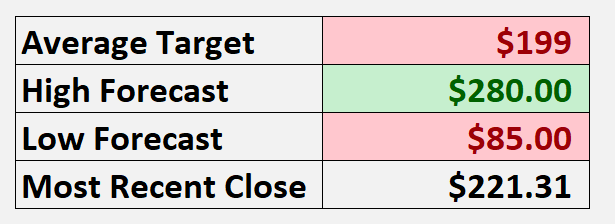
Wall Street Analysts’ Estimates
Based on 29 Wall Street analysts offering 12-month price targets for Tesla in the last 3 months. The average price target is $199.00 with a high forecast of $280.00 and a low forecast of $85.00. The average price target represents a -10.08% change from the last price of $221.31. The disparity of analysts’ opinions tells us that the volatility is baked into the price.
Analysts and traders alike see $TSLA as a very polarizing stock.
52-Week High and Low Boundaries
Looking at the Long-Term chart of $TSLA provides us with the 52-week high and low boundaries. Over the past year we have seen $TSLA trade as low as $101.81 and as high as $314.67. The annual trading range was $212.86. Currently, the stock is trading at the 56th percentile of its annual range.
When navigating the intricate terrain of financial markets, prudent traders typically approach the 52-week high and low-price thresholds with a mix of vigilance and careful optimism. These price limits can function as indicators to discern between trending and consolidating assets.
Seasoned investors, often referred to as ‘Power Traders’, will juxtapose the Wall Street Analysts’ forecasts with these broad volatility estimates, aiming to gain a comprehensive understanding of the price dynamics surrounding $TSLA.
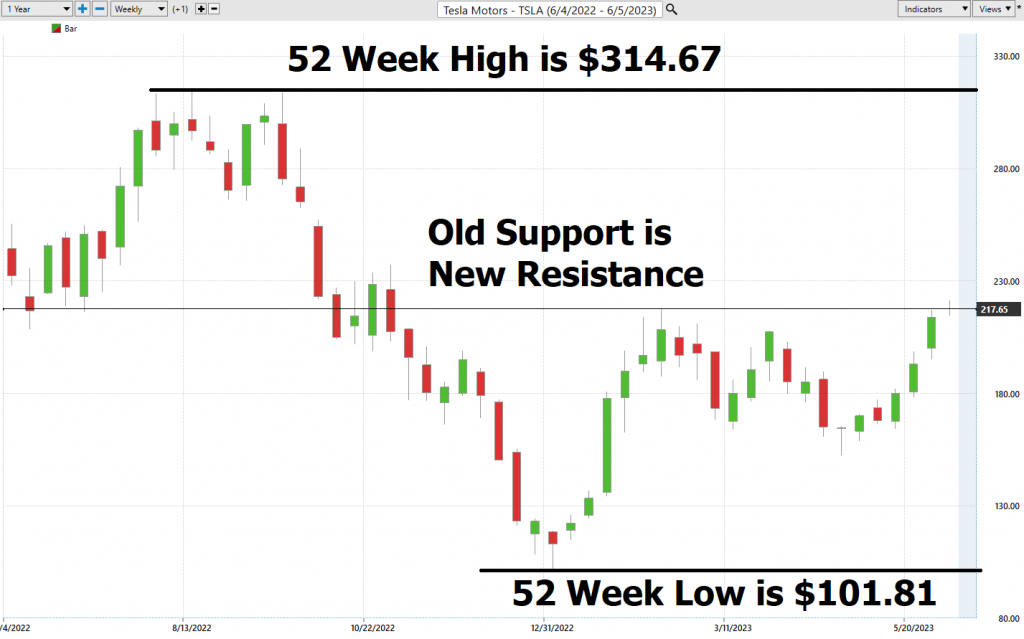
When we divide the annual trading range of $212.86 into the most recent close of $221.31 we determine that the statistical volatility is 96.2%. This number tells us that it would be considered normal for $TSLA to trade 96.2% higher and/or lower over the next 52 weeks.
Next, we zoom out and look at $TSLA on a 10-year monthly chart to get an idea of its longer terms trend and history. By doing so we can quickly see longer-term trends and volatility in this asset.
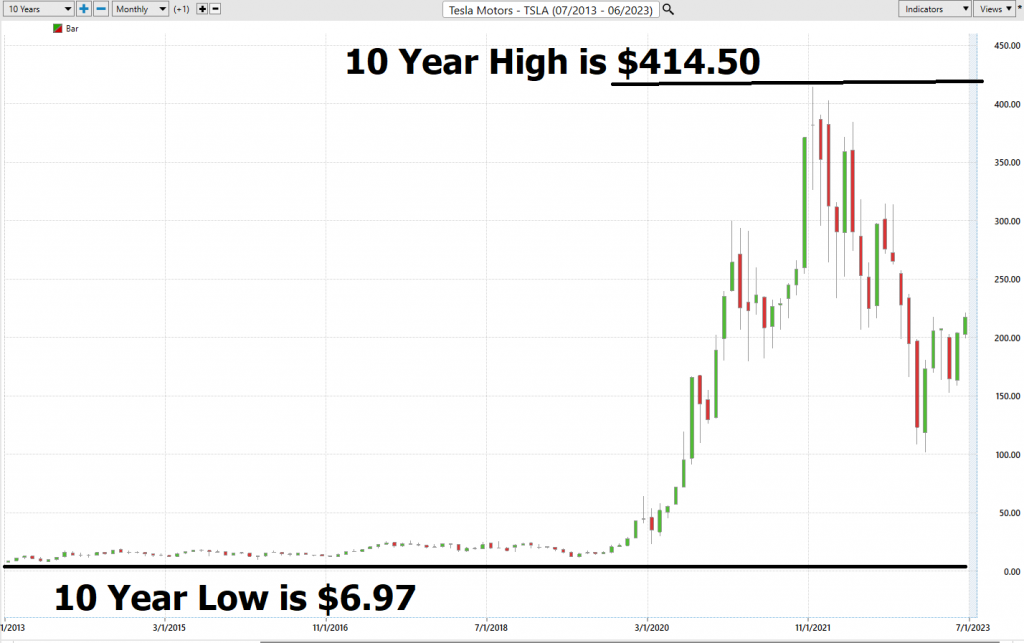
As a point of interest, the average price of $TSLA over the past year has been $209.73. This is calculated by taking the close of each trading session and dividing by 252. The highest price of $314.67 for the year is 50% higher than its average price, and its lowest price of $101.81 is 51.4% lower than its average price. I share this with you because being aware of these extreme percentage oscillations often provides ample reason for price to revert to the mean.
Best Case – Worst Case Scenario
Whenever we evaluate a trading opportunity, it’s imperative to take a well-rounded perspective on the asset in question. A balanced approach involves comparing the peaks of rallies to the troughs of declines, to gain a genuine insight into the asset’s real-time volatility. Moreover, it is beneficial to juxtapose the asset’s performance with the returns of major market indexes.
Rather than reducing this to mere numerical values, we advocate for a more holistic approach that involves a best-case and worst-case analysis. By interpreting these charts, we gain a tangible understanding of what this volatility implies for potential performance.
Exemplary trading hinges on a deep awareness of an asset’s potential volatility. As traders, we are in search of MOVEMENT. Yet, it’s important to remember that movement is a double-edged sword, with its inherent risks and rewards. By initially examining rallies and declines, we can rapidly ascertain whether an asset is retaining its gains. For context, note that $TSLA has an annualized volatility of 96.2%.
It is worth doing this type of baseline analysis because it allows you to visually ascertain how quickly a stock drops in comparison to the speed with which it moves higher.
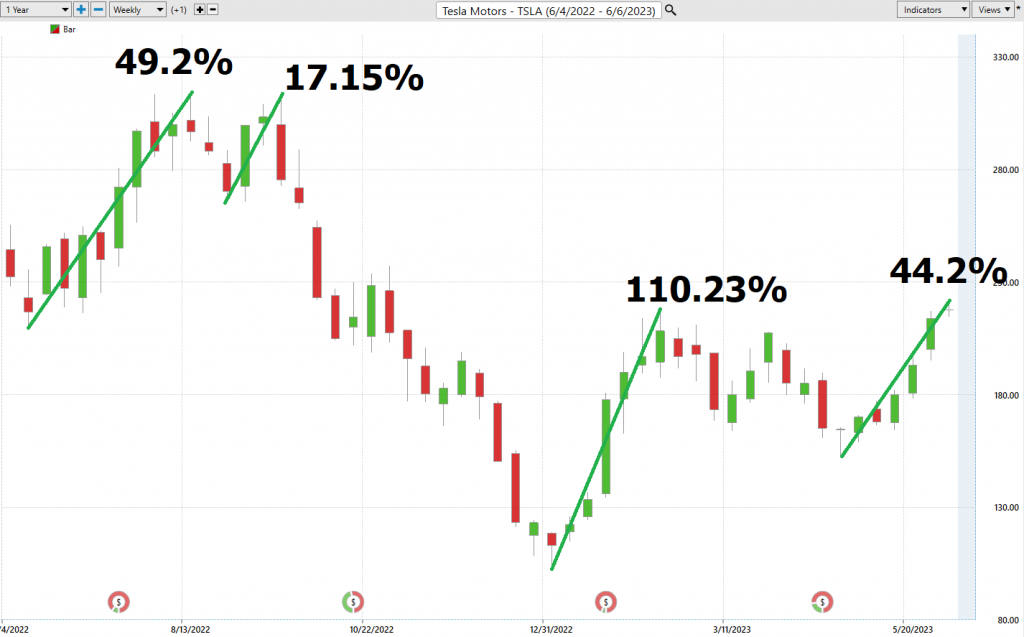
Followed by the worst-case analysis.
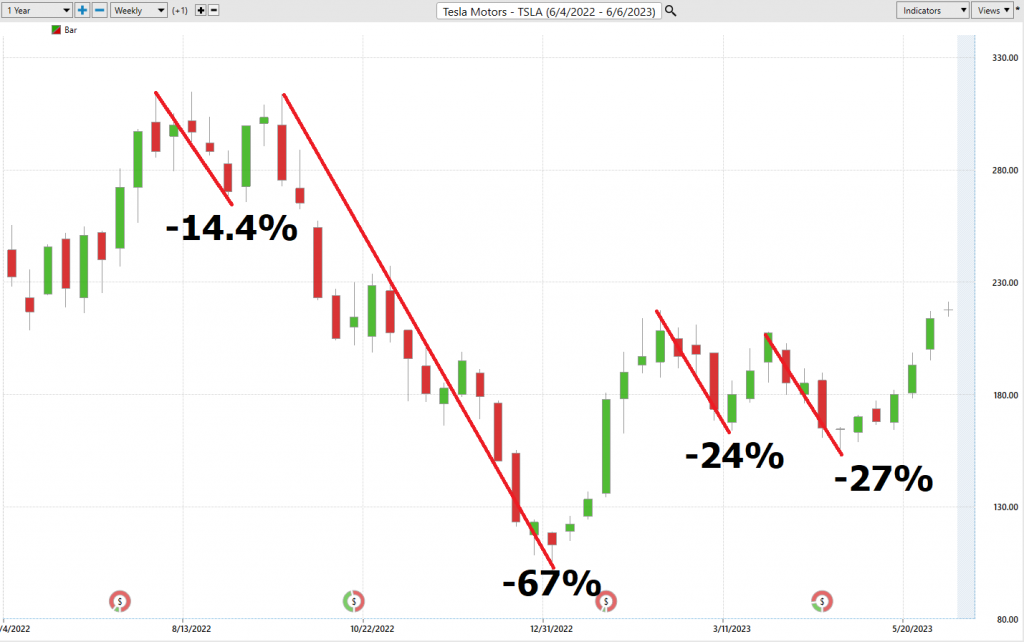
From this simple analysis, you can visualize and compare the rallies to the declines and see how quickly they occurred and whether the gains or losses were sustained.
Next, we want to compare the performance of $TSLA to the major broad market indexes.
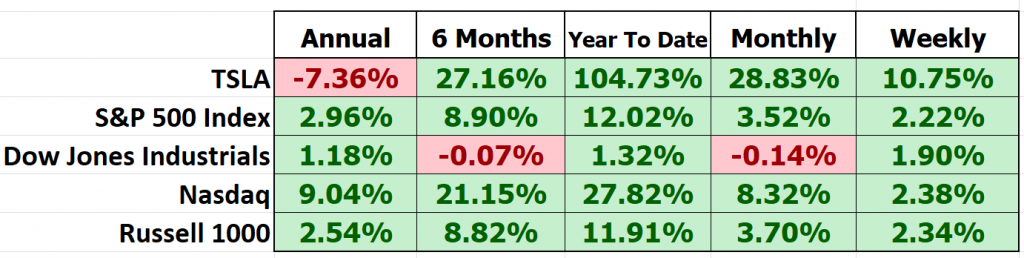
So, in $TSLA we have an asset that you can quickly see is much more volatile than the broader stock market indexes. As a large-cap stock $TSLA comprises 1.6% of the S&P 500 Index and 3.66% of the NASDAQ composite.
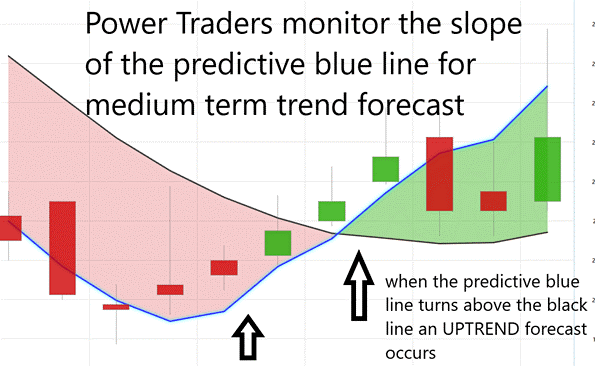
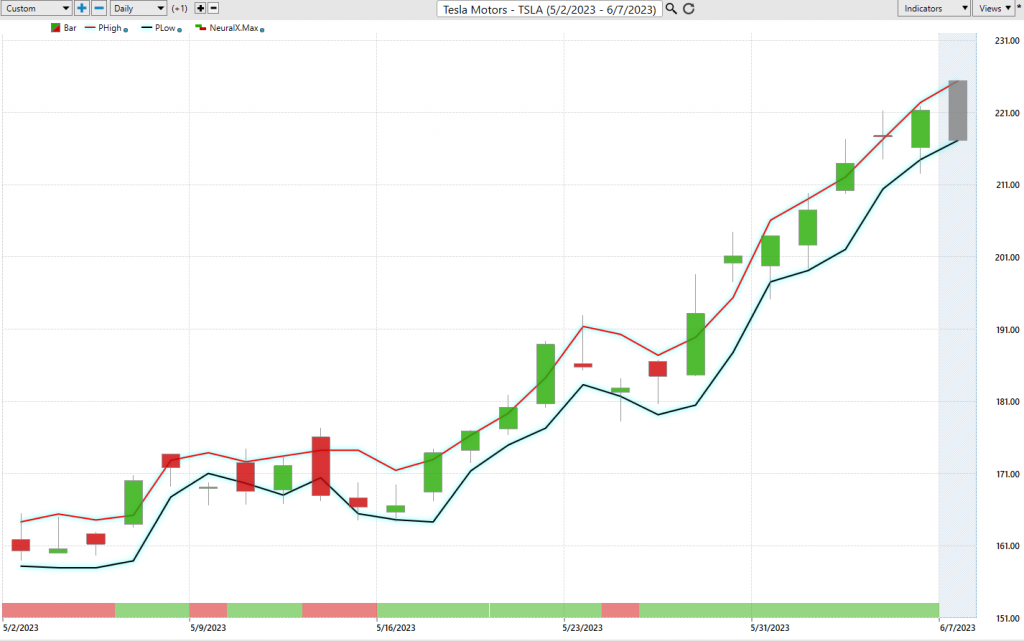
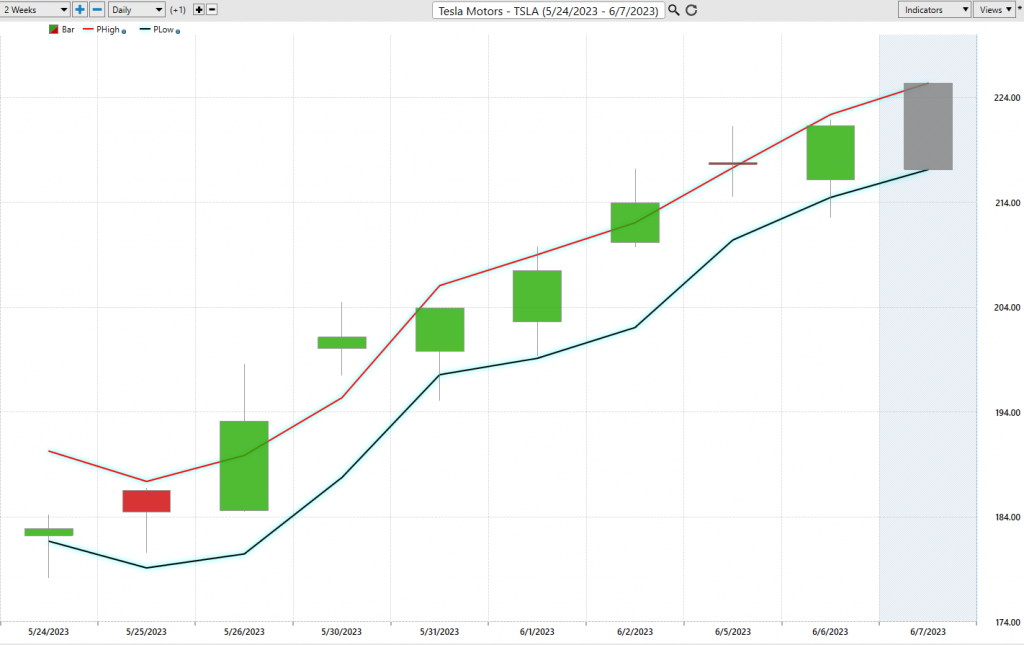
On the following chart you will see the power of the VantagePoint Predictive blue line which determines the medium term trend price forecast.
Vantagepoint A.I. Forecast (Predictive Blue Line)
The guidelines we abide by are as follows:
- The slope of the predictive blue line determines the trend forecast and general direction of $TSLA.
- Ideally, the VALUE ZONE is determined to try and find buy opportunities at or below the predictive blue line, or to sell opportunities above the predictive blue line during a downtrend.
Using VantagePoint Software and artificial intelligence, traders are alerted to trend forecasts by monitoring the slope of the predictive blue line.
The predictive blue line, a product of VantagePoint’s patented Neural Network and Intermarket Analysis, is no mere random figure. It incorporates a sophisticated blend of artificial intelligence, machine learning and statistical correlations to arrive at its value, considering the most influential price drivers of an asset.
What’s particularly intriguing about the chart is that the slope of the predictive blue line essentially functions as a guiding light, akin to the North Star, for traders seeking direction. The fundamental principle is not to fight with the prevailing trend. While trading opportunities may span from a few days to several weeks, the primary aim is to ensure that the trader remains aligned with the right trend at the opportune moment. The blue line remains the cornerstone for forecasting and determining the optimal course of action.
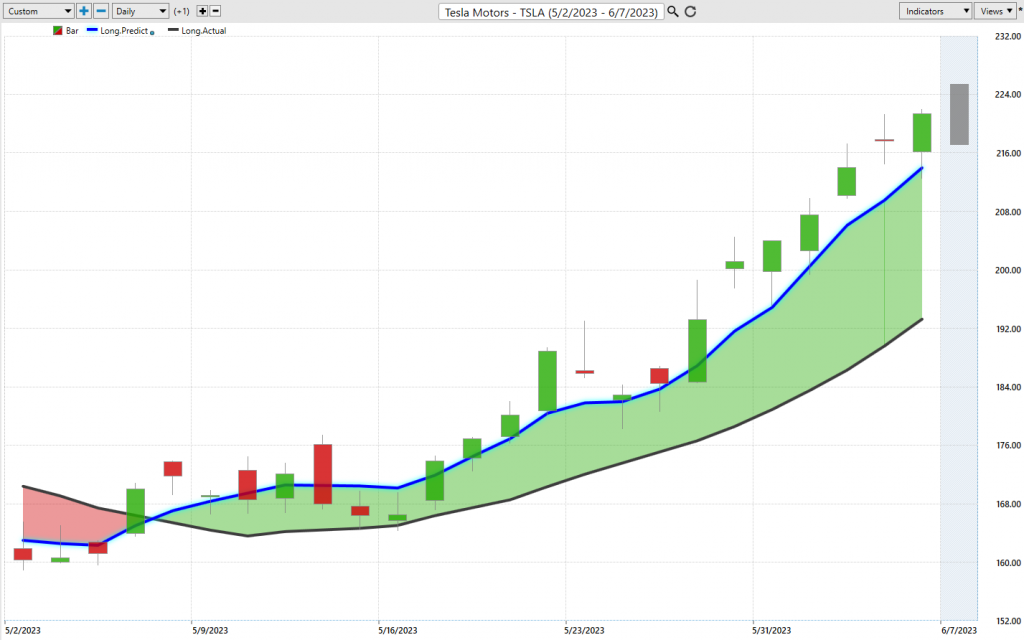
Typically, an uptrend forecast is identified when there are two consecutive closes above the predictive blue line. Conversely, a downtrend forecast generally corresponds to two consecutive closes below the predictive blue line. This analytical approach, grounded in conservative logic, aids in decoding market trends and directing investment strategies. You can see that the trend forecast turned UP on 5/5/23 at a price of $170.06. In the last 22 trading sessions $TSLA is up 29.92%.
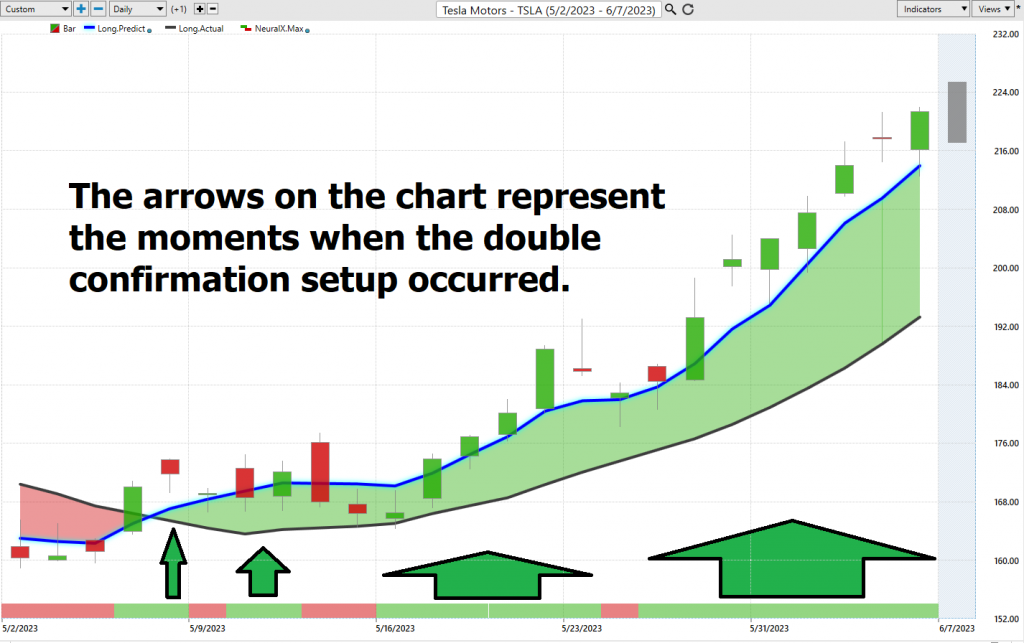
Neural Network Indicator (Machine Learning)
Positioned at the base of the chart is the Neural Network Indicator, a tool designed to predict short-term strengths and weaknesses in the market. When this indicator turns green, it signals market strength, while a red indicator anticipates short-term market weaknesses. If the indicator is yellow, it predicts sideways price movements.
A Neural Network operates as a computational learning mechanism that employs a system of functions to comprehend and translate voluminous amounts of data into a specified output, while perpetually self-monitoring and enhancing its performance.
In the trading world, Neural Networks are AI-empowered algorithms that scrutinize market data and learn from the outcomes, thus constantly assessing relative risks and opportunities. The first step for Neural Networks is to determine the criteria for the market signals they should analyze – these can range from technical indicators, chart patterns, global events, to company projections. After collating the relevant market data, the Neural Network aids traders by generating fresh insights from each experience.
By discerning the relationships between different market triggers and outcomes, it can detect risks or pinpoint new opportunities more swiftly than a human could. For instance, it may perceive correlations between abrupt changes in oil prices and unanticipated fluctuations in a stock index within a certain region, thus providing traders with an advantage over others who might lack this understanding. Ideally Power Traders look for the double confirmation setup. This occurs when both the predictive blue line and neural network are both pointing in the same direction.
Essentially, Neural Networks are adaptable algorithms that mimic facets of the human brain, meaning they can be trained based on specified criteria for evaluating risk and potential rewards to deduce the best course of action.
This allows them to make high probability forecasts based on available historical information.
We advocate that Power Traders cross reference the chart with the predictive blue line and neural network indicator to create optimal entry and exit points.
For the serious trader, neural networks are a next-generation trading tool that can detect subtle non-linear interdependencies and patterns that traditional methods of technical analysis are unable to uncover.
Traders look for confirmation on NeuralNet to position themselves LONG or SHORT in the market. In other words, when the A.I. forecast is green, and The Neural Net is green, that presents a buying opportunity.
The inverse is also true, when the A.I. forecast is red and the Neural Net is red, that is a selling opportunity. The arrows on the chart below highlight the trading zones where Power Traders would’ve been using double confirmation to BUY in cross referencing the A.I. forecast with the NeuralNet.
Power Traders are always looking to apply both the Neural Network and A.I. to the markets to find statistically sound trading opportunities.
VantagePoint Software Daily Price Range Prediction
One of the powerful features found in the VantagePoint Software, heavily relied upon by Power Traders, is the Daily Price Range prediction forecast. This tool allows Power Traders to precisely refine their market entry and exit points.
Here are the average trading ranges have been over the past year on a daily, weekly, and monthly basis for $TSLA.
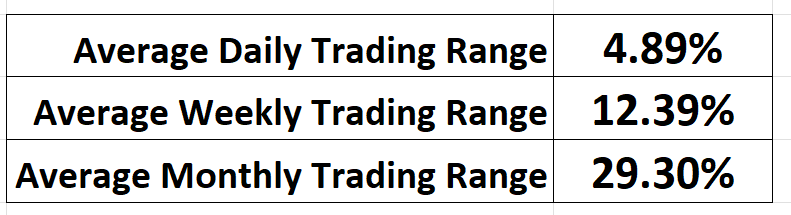
Even with this wealth of information, a trader must decide when to enter and exit the market. Each day, traders grapple with the uncertainty and angst of determining their market buying and selling points. The Daily Price Range Forecast, powered by VantagePoint’s A.I., significantly simplifies this decision-making process by clearly providing a predicted high and predicted low point, thereby clearly delineating the opportunity and trend.
The chart aids traders in establishing where stop placement should occur. Take note of how placing protective sell stops below the dark line on the chart effectively mitigates risk involved in this trade. Simply estimating the range between the high and low of the daily predictive range provides value on where the anticipated support and resistance zones for the day will be.
The upper and lower bands of the price range forecast provide a clear channel of trading activity too. Swing traders continuously seek buying opportunities towards the bottom of the predicted channel and aim to identify selling opportunities above the top band. While this requires a cautious approach, it is a strategy imbued with the potential for positive outcomes.
Intermarket Analysis
Power lies in the way we respond to the truth we understand.
Intermarket analysis is a method of analyzing markets by examining the correlations between different asset classes. These asset classes include bonds, commodities, currencies, and stocks. The underlying concept is that no market or asset class moves in isolation. Therefore, an event or trend in one market can have an impact on another, even if they are quite dissimilar.
Intermarket analysis was born out of the recognition of this interconnectedness, which became particularly apparent in the aftermath of the 1987 stock market crash. This event underlined the fact that it was no longer sufficient to look at markets in isolation. Traders and investors began to appreciate the importance of considering global interrelationships between different asset classes to predict the direction of specific markets more accurately.
Applying intermarket analysis helps traders to make more informed trading decisions. By understanding the relationships and correlations between different markets, traders can identify possible leading indicators in one market that could forecast a change in trend in another. For example, a significant increase in the price of oil (a commodity) can hint at future inflation, which can affect interest rates and in turn influence the bond and stock markets. Thus, intermarket analysis allows traders to potentially anticipate and profit from these shifts.
We live in a global marketplace.
Everything is interconnected.
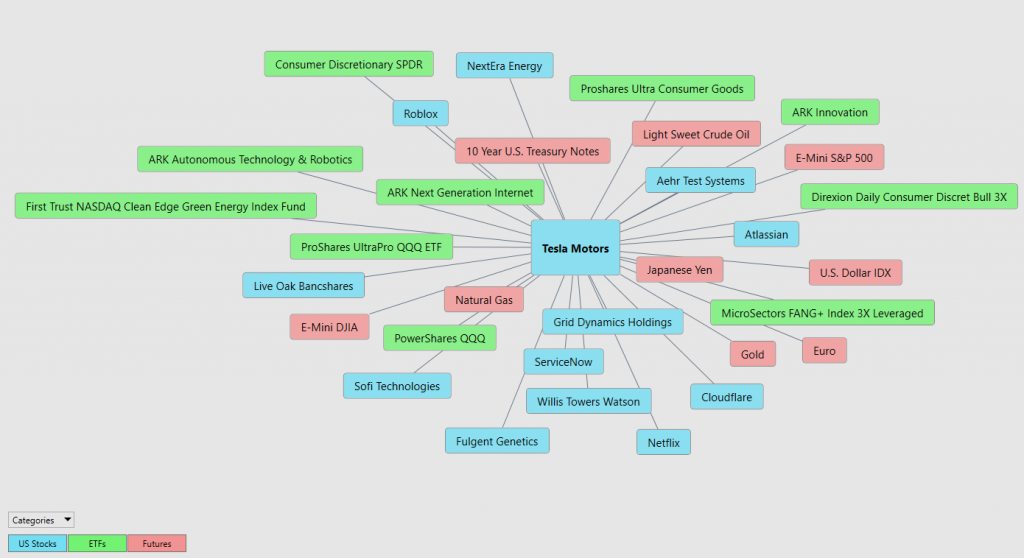
Interest rates, Crude Oil Prices, and the volatility of the Dollar amongst thousands of other variables affect the decisions companies must make to flourish and prosper in these challenging times. Trying to determine what these factors are is one of the huge problems facing investors and traders.
There is great value to be had in studying and understanding the key drivers of $TSLA’s price action. This graphic provides a microcosmic view of what factors have been driving $TSLA’s higher. You will find all of the prominent stock indexes and tech ETF’s that are big owners of $TSLA in that graphic.
Trading Suggestion
Since $TSLA is a component of the NASDAQ index, the S&P 500 Index, and the Dow Jones Industrials we can appreciate how much enthusiasm exists for an UPTREND to return. As goes $TSLA so often go the broader market indexes. Our suggestion is not to conflate $TSLA with these indexes though. Since the beginning of the year the 8 largest market cap companies have all had tremendous rallies. They are responsible for the gains we have seen across the broader stock market indexes.
Tesla has numerous major challenges in 2023.
If you think RECESSION will happen in 2023 either domestically or worldwide, $TSLA is a bad purchase. Traders could focus on the short term and look for swing trading opportunities.
Currently, as this gets published, the trend is UP.
Momentum is UP.
Based upon the trading range possibilities we will continue to look for trading opportunities based upon the Vantagepoint Daily Range Forecast.
We like the reality that the stock is highly volatile, which gives our trading style an edge. We will continue to explore the long side of the market for short-term swing trading opportunities.
Our recommendation is to follow the A.I. trend analysis as outlined in this stock study and practice good money management on all trades.
We will re-evaluate daily based upon:
-
- New Wall Street Analysts’ Estimates
- New 52-week high and low boundaries
- Vantagepoint A.I. Forecast (Predictive Blue Line)
- Neural Network Forecast
- Daily Range Forecast
The trend in $TSLA is UP. Pay attention to the next earnings call in $TSLA on July 23, 2023, as it will determine whether advertising is working in helping to promote Tesla vehicle sales.
Let’s Be Careful Out There!
It’s Not Magic.
It’s Machine Learning.

IMPORTANT NOTICE!
THERE IS SUBSTANTIAL RISK OF LOSS ASSOCIATED WITH TRADING. ONLY RISK CAPITAL SHOULD BE USED TO TRADE. TRADING STOCKS, FUTURES, OPTIONS, FOREX, AND ETFs IS NOT SUITABLE FOR EVERYONE.
DISCLAIMER: STOCKS, FUTURES, OPTIONS, ETFs AND CURRENCY TRADING ALL HAVE LARGE POTENTIAL REWARDS, BUT THEY ALSO HAVE LARGE POTENTIAL RISK. YOU MUST BE AWARE OF THE RISKS AND BE WILLING TO ACCEPT THEM IN ORDER TO INVEST IN THESE MARKETS. DON’T TRADE WITH MONEY YOU CAN’T AFFORD TO LOSE. THIS ARTICLE AND WEBSITE IS NEITHER A SOLICITATION NOR AN OFFER TO BUY/SELL FUTURES, OPTIONS, STOCKS, OR CURRENCIES. NO REPRESENTATION IS BEING MADE THAT ANY ACCOUNT WILL OR IS LIKELY TO ACHIEVE PROFITS OR LOSSES SIMILAR TO THOSE DISCUSSED ON THIS ARTICLE OR WEBSITE. THE PAST PERFORMANCE OF ANY TRADING SYSTEM OR METHODOLOGY IS NOT NECESSARILY INDICATIVE OF FUTURE RESULTS. CFTC RULE 4.41 – HYPOTHETICAL OR SIMULATED PERFORMANCE RESULTS HAVE CERTAIN LIMITATIONS. UNLIKE AN ACTUAL PERFORMANCE RECORD, SIMULATED RESULTS DO NOT REPRESENT ACTUAL TRADING. ALSO, SINCE THE TRADES HAVE NOT BEEN EXECUTED, THE RESULTS MAY HAVE UNDER-OR-OVER COMPENSATED FOR THE IMPACT, IF ANY, OF CERTAIN MARKET FACTORS, SUCH AS LACK OF LIQUIDITY. SIMULATED TRADING PROGRAMS IN GENERAL ARE ALSO SUBJECT TO THE FACT THAT THEY ARE DESIGNED WITH THE BENEFIT OF HINDSIGHT. NO REPRESENTATION IS BEING MADE THAT ANY ACCOUNT WILL OR IS LIKELY TO ACHIEVE PROFIT OR LOSSES SIMILAR TO THOSE SHOWN.

