
Rounding Bottom or Cup-and-Saucer Patterns

Not all price patterns produce sharp, distinctive turns in price direction. It sometimes takes time for a top or bottom to emerge gradually over a number of price bars/candles. These patterns include the rounding bottom or the cup-and-saucer (although it really should be the saucer-and-cup formation in the chronological sequence). These patterns are generally associated with bottoms but may occur at tops as well.
In the bottoming formation, prices drift lower and lower, sometimes with small range periods, until they begin to turn and gradually creep higher. The price reversal bottom is complete when prices move above the lip of the rounding bottom.
Sometimes the bottoming formation takes the shape of a saucer and cup, combining a rounding bottom with a little setback at the right side of the formation that becomes a “cup” (or a cup and a cup handle in some descriptions). When prices move above the lip of the cup (dashed line), the bottom is in, and prices continue to the upside.
Note the pattern of volume in connection with the pattern of prices in the chart below. When the market is ready to move, prices break higher on much higher volume, authenticating the breakout.
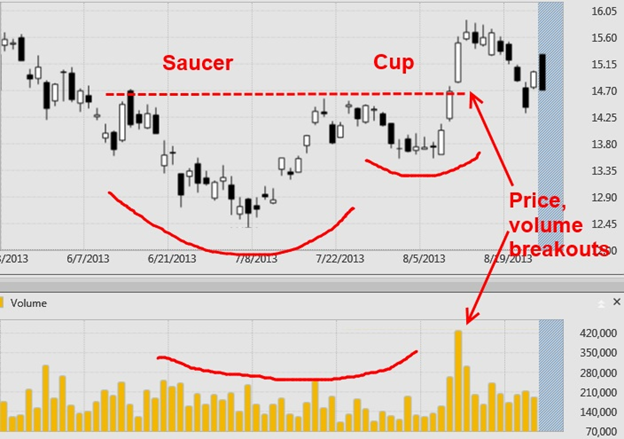
Source: TradeShark
