
Technical Trading 101: How To Trade A Basing Bottom Formation

Trending Market Conditions either up or down, are easier to trade and most of the time Technical Traders do very well during Moderately Uptrending or Momentum Upside Market Conditions. However when markets shift to sideways price action during a Market Correction, most Technical Traders assume the market is “volatile” and find it a challenge to make sense of how and when to trade.
Volatile is an overused and misused term. Often what the retail news describes as “volatile Market Conditions,” is actually a Shift of Sentiment™ that the retail crowd is blissfully and harmfully unaware is occurring. Rather than volatile the sideways action is actually a compaction phase, where Dark Pool giant lot buyers collide with Smaller Funds that are dumping in capitulation mode. This collision makes it “feel” like the day to day action is very volatile or “unpredictable.”
Technical Traders who want to achieve high income with a consistent 75% or better profitability over time, need to be able to read a stock chart properly. One aspect that is missing in most Technical Trader education these days, is the new sideways price patterns that did not form even a decade ago. With so many articles, books, and videos on the internet that were written over 20 years ago, Technical Traders are not prepared for the changes in price patterns occurring in the stock market today.
The Basing Bottom Formation is an example of a current sideways price pattern that is becoming a common bottom. See an example of it in the chart below for Air Products & Chemicals (APD: NYSE).
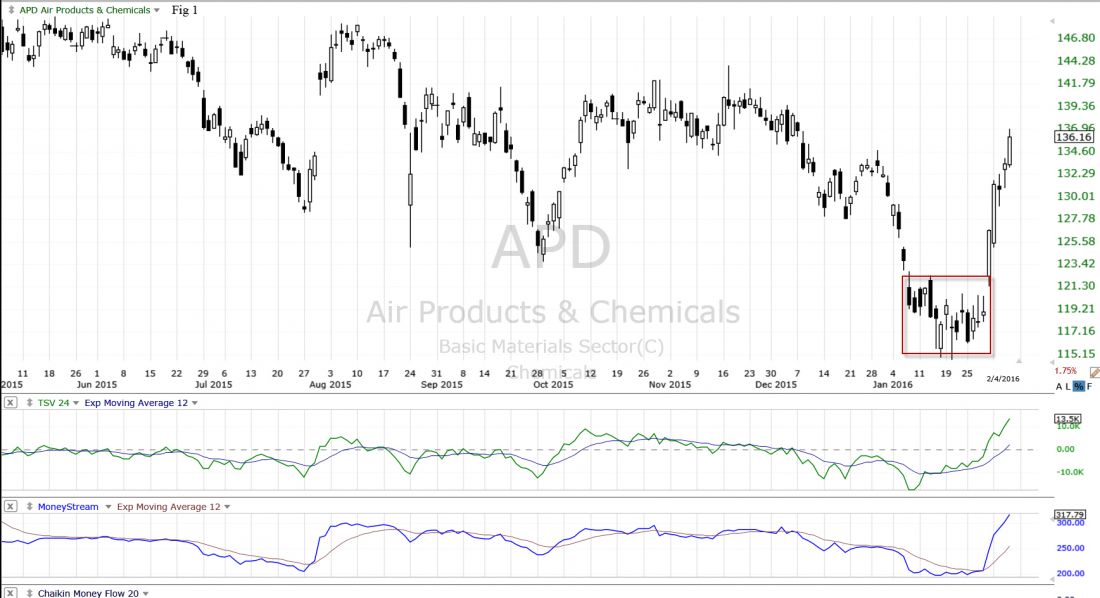
APD shows a Basing Bottom followed by a sudden momentum run. A Dark Pools Shift of Sentiment Pattern precedes the momentum run up. A second chart example of this kind of new bottom formation is Praxair Inc. (PX: NYSE) below.
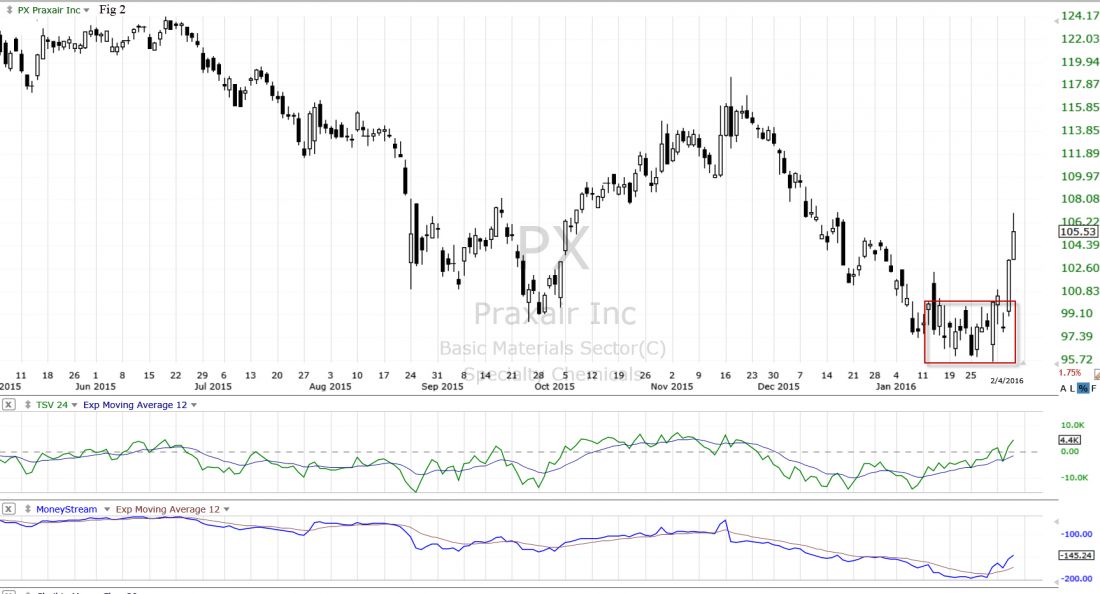
PX also has a Basing Bottom followed by momentum action.
The Basing Bottom is one of the new bottom formations which develops due to the giant lots using Dark Pool Alternative Trading Systems ATS trading venues, and the multiple types of sophisticated Time Weighted Average Price TWAP orders that they can use. Their buying patterns are consistent but they also contain price in a tighter pattern than what used to occur in previous years, before the giant lots moved off the exchanges and into the ATS platforms.
Summary
Learning to identify the Dark Pool Buy Zones™ and the price action that giant lots create when they are accumulating that begins a stock Bottoming Formation pattern, is critical to trading so called “volatile” Market Conditions.
When Technical Traders are able to quickly identify the Basing Bottom Formation as an example, they can switch quickly from Selling Short to preparing for the big sudden Momentum runs that occur after the bottom formation concludes. These Short Term Trend Style bottoms are becoming more and more common, but few Technical Traders have ever heard of these types of bottom formations.
Trade Wisely,
Martha Stokes CMT
TechniTrader technical analysis using TC2000 charts, courtesy of Worden Bros. Inc.
Disclaimer: All statements are the opinions of TechniTrader, its instructors and/or employees, and are not to be construed as anything more than an opinion. TechniTrader is not a broker or an investment advisor; it is strictly an educational service. There is risk in trading financial assets and derivatives. Due diligence is required for any investment. It should not be assumed that the methods or techniques presented cannot result in losses. Examples presented are for educational purposes only.
