
Support and Resistance

Technical analysis begins with identifying the trend line as early as possible, but there are times when that trend line or its parallel channel line will be tested by price action. That leads to the concept of support and resistance, the points at which a market will find pressure to move higher or lower, depending on the trend.
Projecting trend lines to determine where areas of support and resistance areas may occur is extremely effective in technical analysis. As the charts in the trend line discussion illustrated, a trend line along the lows in a rising market or across the highs in a declining market can be a key barrier for prices to cross, as the wheat chart below illustrates. Prices may bounce off those trend lines if the trend is to continue, but a break of those trend lines suggests a possible change in trend direction.
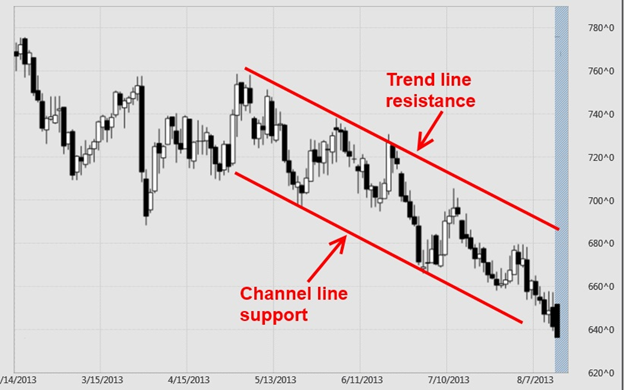
Source: TradeShark
But trend lines aren’t the only source of support and resistance. One of the favorite methods for determining support and resistance levels is to look at past price history on a chart to see at what price levels the highs, lows and closes seem to be touching the most. This method of determining support and resistance levels works on any bar chart time frame – hourly, daily, weekly or monthly.
Many times a bunch of high or low prices will be concentrated in a small area on a chart but not at one specific price. Instead, you have a support or resistance “zone” that should be rather narrow to be effective.
Major price tops and bottoms from the past are also major resistance and support levels. The rationale is that if the value of a market reached a price level previously in similar conditions, that value is likely to influence the limit on price movement in the future.
Unfilled price gaps on charts or moving averages, especially longer-term ones, also qualify as very good support and resistance levels, not necessarily because they are at a specific price level but because traders view these points as potential support or resistance.
In some cases, support and resistance levels can be determined by “psychological” price levels. These are usually round numbers that are very significant in a particular market. For example, in crude oil, a psychological price level might be $100 per barrel. For soybeans, that might be $5 or $6 or $10 per bushel. These levels mark clear step-up or step-down prices where the market often pauses to reassess the value situation.
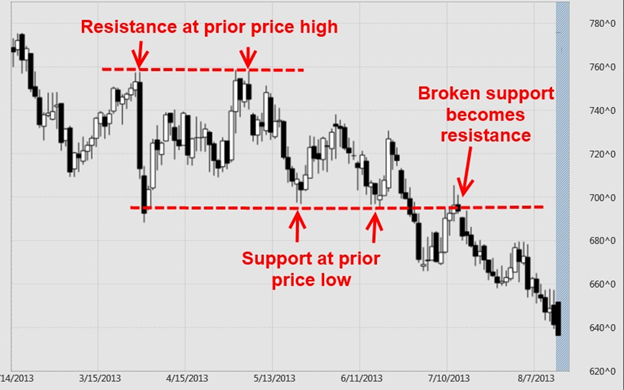
Source: TradeShark
Many chart patterns develop as a result of price action at support and resistance areas. For example, looking at the same wheat chart above, a double top may form because prices cannot move above a previous high or a double bottom may form because prices find support from an earlier bottom.
These points become increasingly important support or resistance areas when prices approach those price levels in the future. When prices do break through those areas, that may be the key signal for a trading position based on breakout strategies.
One important point to note about support and resistance is that when a key support level or zone is penetrated on the downside, that level or zone will likely become key resistance. Likewise, a key resistance level or zone that is penetrated on the upside will then likely become a key support level or zone.
