
Time Segmented Volume – The Ideal Oscillator For Automated Markets

The modern market structure employs order types that are automated, which creates different patterns on charts. This requires a different type of oscillator for the best technical analysis.
Although most technical traders are familiar with and use price and time oscillators, few use volume oscillators. Volume oscillators are uniquely different than price oscillators. Instead of signaling overbought or oversold price action, the volume oscillator provides far more valuable information about what is going on with the stock price before price actually moves.
This gives technical traders a leading indicator that indicates the direction of price, breakout moves, momentum runs, and bottoms or tops ahead of price action.
Volume oscillators can be based on quantity and time, or a few are hybrid indicators based on quantity, price, and time. The best hybrids track accumulation and distribution patterns.
The most popular price and time oscillator is Stochastic, written by George Lane in the 1950’s, when the market was range bound in a wide sideways pattern for several years. It has the classic high line at 80% signaling overbought conditions for price, and the low line at 20%, which was considered oversold.
By contrast, volume oscillators do not have overbought/oversold lines, but, instead, have a center line that is the oscillation level for the indicator.
Time Segmented Volume (TSV) is a volume oscillator, and considered one the best volume oscillators ever written. It was designed by Don Worden, the only indicator writer to devote his entire work to developing quantity indicators that could reveal and disseminate large-lot vs. small-lot activity. This is a crucial aspect of identifying dark pool, large-lot activity, which is so prevalent in the today’s automated marketplace.
How to Interpret Time Segmented Volume
TSV oscillates around a center line. When the indicator line is above the center oscillation line, the large lots are buying. When it trends down, and begins oscillating below the center line, this is distribution.
The chart example #1 below shows that TSV holds steady above its center line, oscillating in a tight pattern during a platform building phase for the stock. Platforms are a new sideways pattern that occurs often in our modern markets due to the controlled bracketed orders the giant funds use for accumulation and distribution. Platforms tend to have very consistent highs and lows for the range, and are much narrower than typical trading ranges which do not form consistent highs and lows.
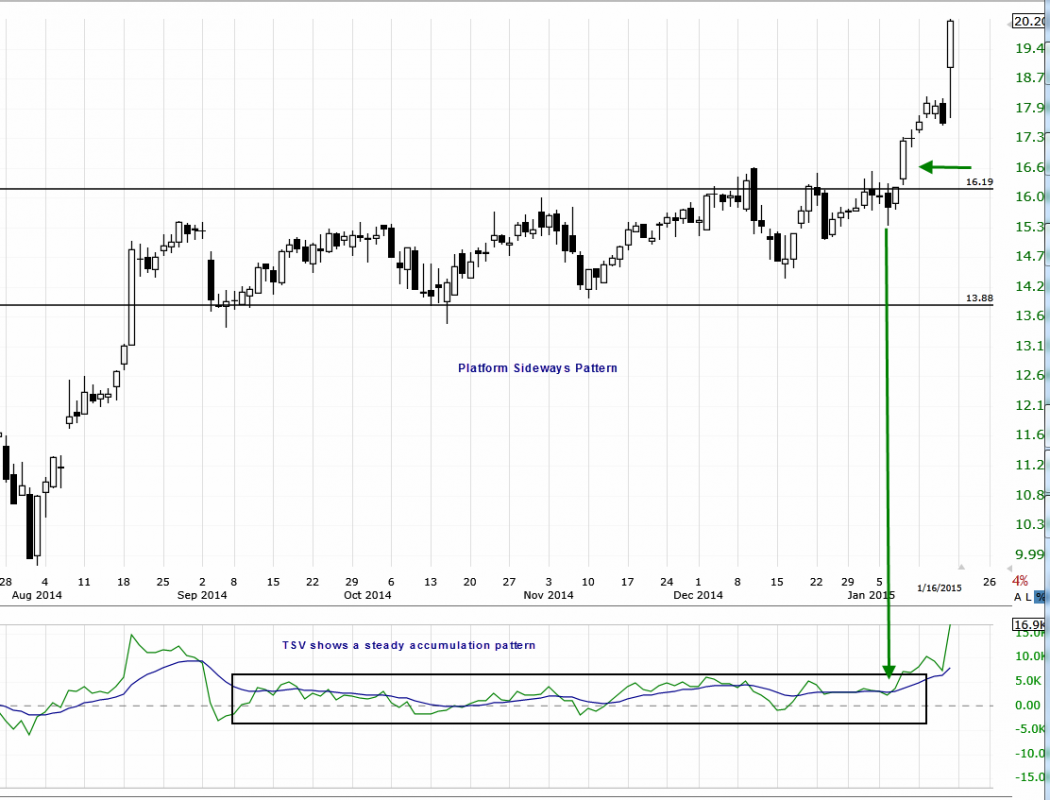
Platforms occur during the Platform-Market Condition, when dark pools are consistently accumulating stock. These are conservative markets, which most technical traders often call “volatile,” but they are actually a highly controlled price action. Whenever highs and lows of a sideways pattern are this consistent, TSV is the rare indicator that can expose the breakout before price does breakout. Using an exponential moving average (EMA) with TSV provides the easy-to-read crossover signal prior to the breakout move.
This is a huge advantage for technical traders, especially during choppy sideways markets. Being able to see the breakout crossover signal pattern on TSV allows traders to get in ahead of the breakout.
The chart example below is another TSV crossover signal after a compression pattern during a base bottom formation.
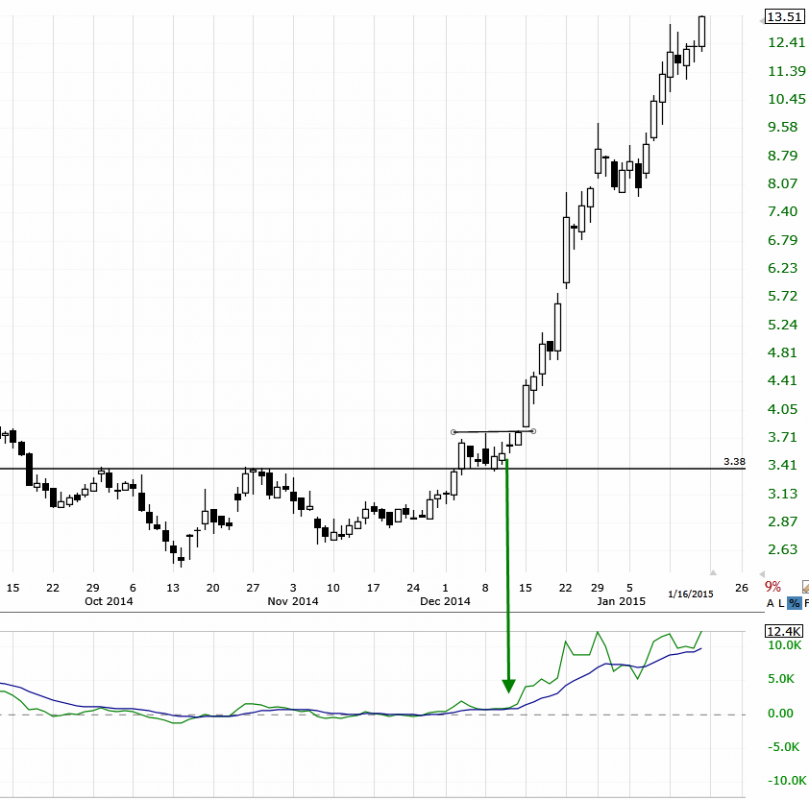
The advantages of the volume oscillators such as Time Segmented Volume is that the giant funds who trade on the Dark Pool ATS platforms do not move price while they are accumulating or distributing. Therefore, only quantity indicators are able to reveal their activity before price moves due to the heavy buying dominance of the giant funds.
The incremental buying patterns in bottoms are easily revealed with TSV. One of the distinct advantages to using TSV is its ability to show a bottom formation, prior to the bottom showing on price.
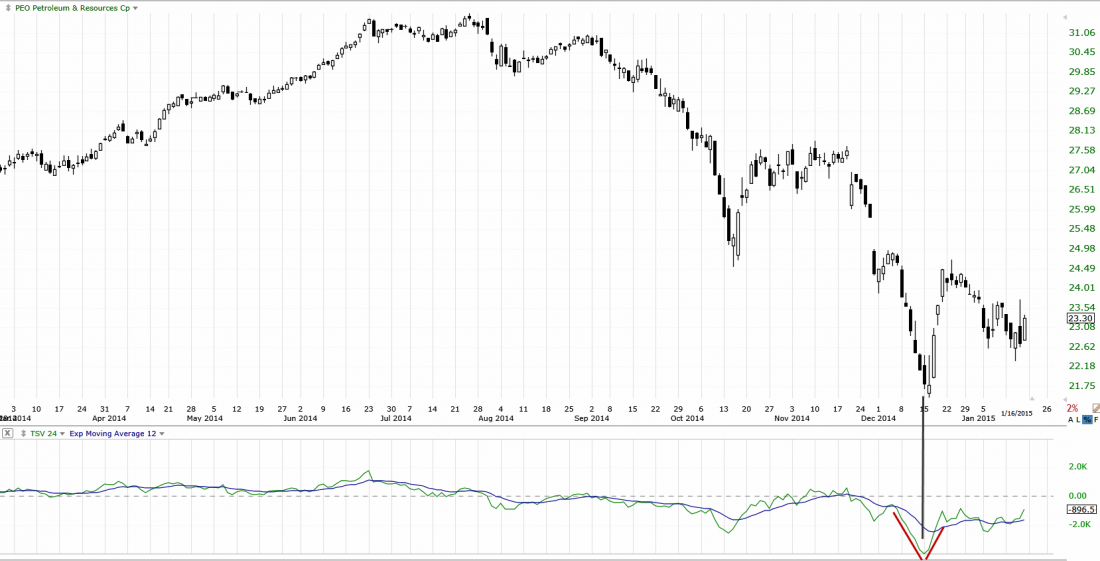
The chart example below is a chart with the distinct V Bottom formation on the TSV chart. The V Bottom starts as the TSV indicator spikes downward to hit the bottom of its chart. This signals ahead of the price reversal pattern and long white candle. The TSV indicator steadily climbs upward toward the center line even while the stock slips down due to late sell shorters, who are attempting to sell short while the giant funds are quietly accumulating the stock as bargain hunters via Dark Pools. The hidden giant lot transactions often cause whipsaw trades for sell shorters who are using price and time oscillators or other price indicators, but are not using quantity indicators.
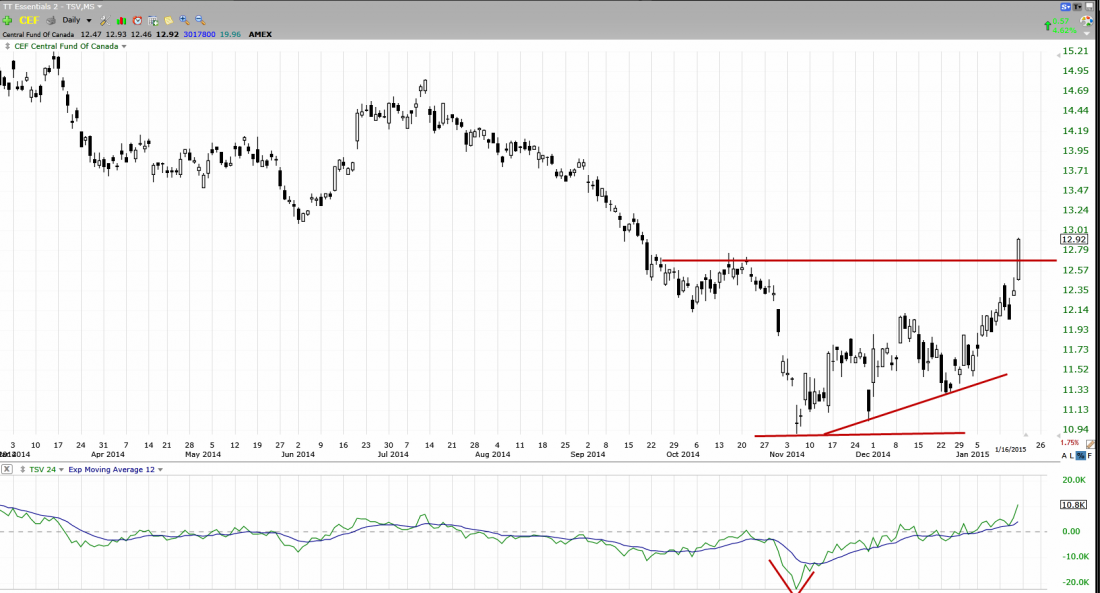
The chart example below shows another V bottom on TSV, and how this quickly develops into a completed short-term bottom. With 80% of all market orders now fully automated, price patterns do not always clearly define a bottom until the move up has already occurred. Often, price does not have the traditional bottoming shapes most technical traders have learned. This type of bottom requires a Time Segmented Volume V shape bottom to reveal that a bottom is underway, and that the control of price has shifted from sellers to the bargain hunter buyers.
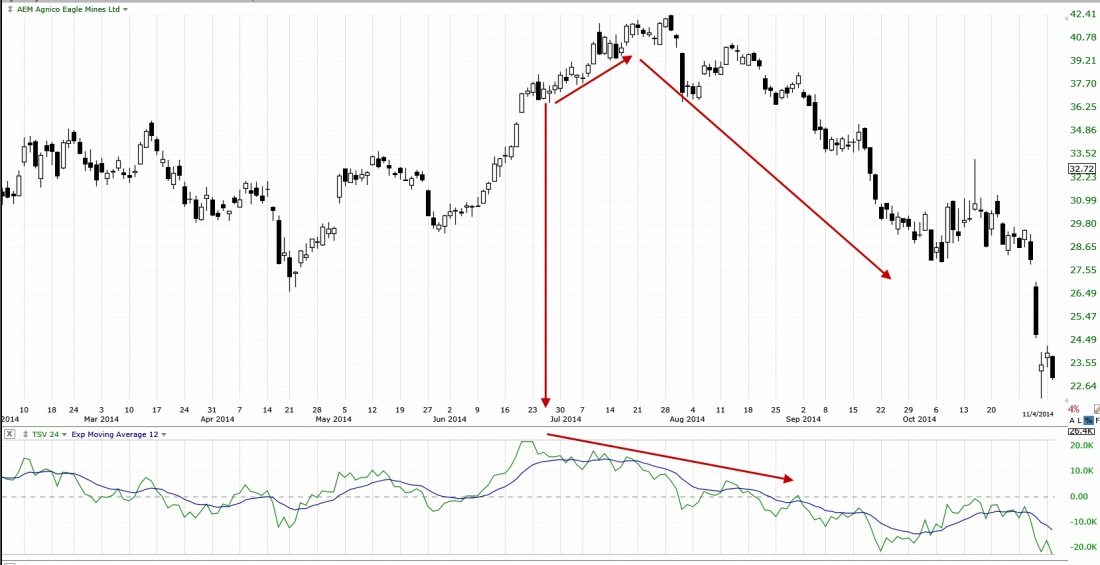
Another highly valuable pattern with the TSV volume oscillator is the topping formation. This is a leading indication that the stock is about to form a top. The TSV indicator exposes the distribution pattern of the Dark Pools quietly selling the stock even while smaller lot buyers push price up to the final high before the correction.
The chart example below shows how being able to see the Top formation on TSV, allows technical traders to plan well in advance of the stock topping and subsequent correction. This saves many swing traders from whipsaw action and losing trades. It also allows the swing trader to enter the sell short mode sooner for more profitability.
Summary
Unlike most price and time oscillators which are designed primarily for trading range market conditions, volume oscillators work in most market conditions and are particularly useful in moderately trending, platforming, bottoming, topping, and velocity market conditions.
TSV is one of the best of the volume oscillators, as it not only provides volume oscillation, but defines whether volume is accumulation or distribution. TSV is a leading contrarian indicator, warning early of a risk of a top and the commencement of a bottom formation at the earliest stages of either.
TSV has many different signal patterns including spikes, top and bottom patterns, and accumulation or distribution patterns. Applying a subordinate indicator, such as an exponential moving average, moving linear regression, or linear regression lines, helps define contrarian patterns and crossovers or divergences. TSV can also be combined on the chart with Bollinger Bands (%B) for a unique indicator for position traders.
Volume oscillators are important indicators for all trading styles.
Thank You For Reading My Article
#####
More Related Reading from Martha Stokes …
Track The Dark Pools With The Balance Of Power (BOP) Indicator
Disclaimer: All statements are the opinions of TechniTrader, its instructors and/or employees, and are not to be construed as anything more than an opinion. TechniTrader is not a broker or an investment advisor; it is strictly an educational service. There is risk in trading financial assets and derivatives. Due diligence is required for any investment. It should not be assumed that the methods or techniques presented cannot result in losses. Examples presented are for educational purposes only.
