
Day Trading Without Charts – Volume Profile In Action
When most people hear about day trading without charts, it conjures up images of other feats of derring-do –boxing with one arm tied behind your back, tightrope walking blindfolded, and bringing a knife to a gunfight all come to mind.
Are we discussing a feat possible only by the fearless few, or is it possible that Day Trading Without Charts is something that is quite straightforward? The fact is we are conditioned to use charts because every trading book, course, and educational forum is focused on charts. The downfall of charts is that they can be misleading in terms of where people’s positions lie.
If we aren’t using charts, then what information are we using? What we are looking at is “Volume at Price,” also known as “Volume Profile,” which is the total number of contracts traded at each price for the current trading session. Consider the following scenario
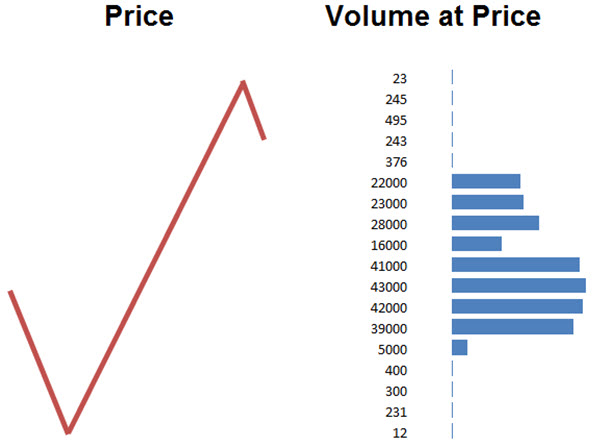
Image 1 – Chart and Volume Profile Perspective
In traditional chart-based analysis, the swing low and swing high would now be considered potential support and resistance. The volume profile, on the other hand, tells a rather different story. We can see that the top five prices have very few contracts traded; there are very few positions there. Similarly, the bottom four prices have very few contracts traded. The significant areas are those where the majority of trading took place. The 22,000 contracts at the top of the high-volume area of the volume profile are far more significant than the 23 contracts traded at the highest price.
Before we go any further, we need to consider what those numbers represent. They represent trades of course. A trade occurs when a buyer is matched with a seller. So the 22,000 contracts traded means 22,000 sold and 22,000 contracts bought.
We also have to consider the fact that not all of the buyers and sellers have the same trading horizon or goals. So, of the 22,000 buyers and sellers, some will be:
- People Closing Positions. Those traders are off our radar, we don’t care about them; they will not be forced to react to price moves in the short term.
- Long-Term Positions. (longer than intraday) We really don’t care about these traders. They also will not react to short-term price fluctuations. They are establishing long-term positions and won’t be reacting to intra-day fluctuations, unless there is a major correction.
- Arbitrage/Spread Traders. These traders will be in and out intraday, but their positions straddle two or more markets. They are trading the relationship between these markets, so they are watching that relationship and not reacting to fluctuations in just one of the markets in their trade.
- Short-Term, Intraday Traders. This represents the bulk of trading in many markets. Certainly in US Index futures. These traders will react to short-term price fluctuations and their reactions are reasonably predictable and quite visible.
This is somewhat of a simplification, but, basically, we can forget about long-term traders and arb/spread traders because they don’t react predictably to short-term price fluctuations. Neither do traders that just got out. It is the positions of short-term, intraday traders that will set the tone for intraday moves. Of course, sometimes there will be one-way, high-volume-news driven days where institutional buying/selling is driving price in one direction. These are the minority, and we all know what to do on those days anyway (no, not fade the move until you empty your account).
Let’s consider the image above once more. We can see a lot of volume traded over 9 prices. From the 22,000 at the top of the high volume area to the 5,000 at the bottom, there’s 259,000 contracts traded. Some will have been in and out, but there are still a lot of intraday traders positioned in that area both long and short.
If we look at the push through the top of the high volume area, do we see any evidence that one side has given up or stopped out? Well, no. If we look at the amount of contracts traded there, it’s less than 1,400. If we have hundreds of thousands of short positions in an area and the shorts get stopped out, they will do some by buying to cover. That buying will drive price up violently, so we’d expect to see a larger move up with more volume per price.
In this situation, the shorts are still in. As we return to the top of the high volume area, the most likely scenario is that we will fall back into that range, traverse to the other side, and then find support at the low of the high volume area. Lots of traders have been comfortable trading in that area and there’s no sign any have been stopped out.
Let’s consider at a slightly different scenario …
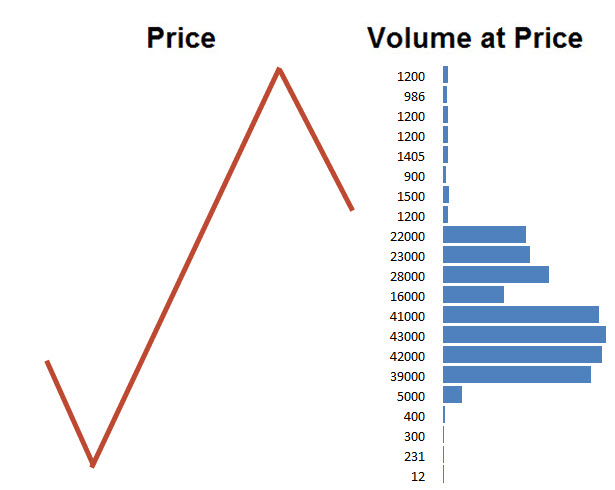
Image 2 – Stop Run
In this case, we can see a larger pop through the top of the high-volume area with a lot more contracts traded in the move up. These stop runs have certain characteristics – the move itself will be rapid; the number of contracts traded at each level is set by the size of the offers there; they get hit before they can move out of the way. You are looking for a fast pop up that takes out the offers. It’s not a slow lazy push through the top.
We already said that in the high volume area, we have positions both long and short. Now that we have had a fast pop through the top, some of the shorts are out of their positions. The remaining shorts are nervous. The longs, well they are just fine.
Think of how you’d feel right now if you’d seen that rapid move through the top.
- If you were long, you’d be happy; you might have even scaled off some of your position. You may now be considering the possibility of an additional move up.
- If you are still short, you are not happy at all, you didn’t get out of your position and price has moved up. You are now fingers-crossed, hoping it’ll come down. Not so you can profit, but so you can get out of the position.
- If you were short and you got stopped out, well your attitude ranges from “I’m fine with that” to “I’m a dumbass,” depending on your level of experience and how well your short followed your game plan.
There is one thing that 99% of people on the short side are not thinking right now and that is “If it comes back down, I’m going to short some more.” Some will relish the chance to buy-to-cover at break even or a little worse to exit their position; some will be sulking because of their loss; and the more pragmatic losers will simply be looking for the next opportunity, not sticking doggedly to the opinion that just caused a loss.
This isn’t so much trading psychology as understanding the process of speculation. After the stop run, we will fall back and sellers just won’t be interested. We often fall back to the tick above the high-volume area and there’s just no selling. The high-volume area and subsequent stop-run cause a “future imbalance” in trading behavior which favored the buy-side. An area where there was a good chance that sellers would shy away, where buyers might even add to their position.
Don’t take my word for this. You can watch it happen every day. This sort of analysis requires a shift in perspective from considering where price has been to where people are positioned, where people lost money and how that may impact their decision making in the short term.
#####
Peter Davies is the founder of Jigsaw Trading. For more information, please click here.
[Note: If you are interested in Volume Profile, read Dr. Kenneth Reid’s daily futures article in TraderPlanet’s Markets on the Move section.]
