April 29 (Bloomberg) – U.S. stocks climbed, pushing the Standard & Poor’s 500 Index toward its best month since 2000, as company earnings topped forecasts, and investors speculated that bank losses peaked. Treasuries fell, while commodities gained.
We often refer to the term ‘cyclical’ but rarely explain what it means. In general… a positive cyclical trend refers to a time period when growth is positive. Another definition that might be more appropriate would be a time frame when the major equity indices are on the rise.
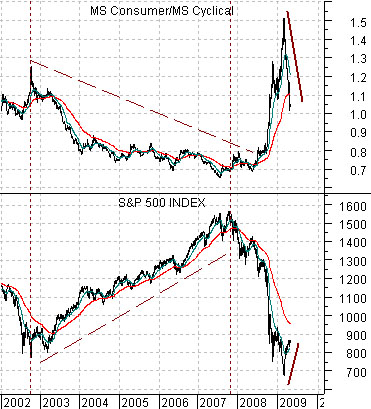
Belowwe show a chart of the S&P 500 Index (SPX) and the ratio between the Morgan Stanley Consumer Index and the Morgan Stanley Cyclical Index. The Consumer Index includes names such as Wal Mart, Coca Cola, and Johnson and Johnson while the Cyclical Index has everything from Citigroup to Dow Chemical.
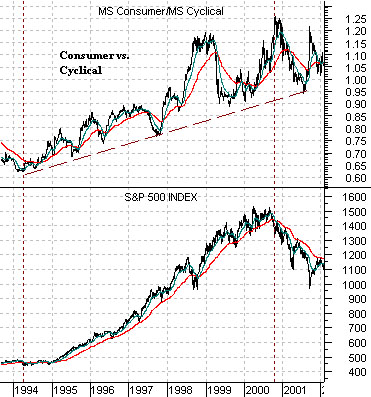
It is difficult to generalize about markets cycles because each tends to be unique in one or more ways. From 1995 through into 2000 the stock market powered higher in what we would term a positive cycle trend even though copper prices actually declined. In other words growth was positive with the focus of growth centered largely in the non-commodity sectors.
We are showing this chart for a reason. It is very important to get the consumer vs. cyclical trend ‘right’ because it tends to run for years at a time. The basic trend from 2002 into 2008 was very close to the opposite of 1995- 2000 as the cyclical sectors rose relative to the consumers.
In any event…below we show crude oil futures and the share price of AMR from 1996 into early 2000. Keeping in mind that the underlying trend dominating the post-1995 was ‘consumer’ as opposed to ‘commodity’ notice what happened to the airlines (and autos) when crude oil prices started to decline in 1997 in the midst of an ongoing positive cyclical trend. We tend to liken this to putting one’s thumb over the end of a garden hose- when one or more ‘cyclical’ sectors turn negative within an ongoing positive trend the flow of money accelerates towards the remaining groups. In response to weakening energy prices the airlines and autos literally ‘took off’ during 1997 and well into 1998. The point? It helps to know the nature of the trend which is why we focus so often on the consumer vs. cyclical ratio.

Equity/Bond Markets
Belowwe show the Consumer/Cyclical ratio along with the S&P 500 Index from 2002 to the present time period.
We are not simply pulling this one ‘out of the air’ to show what happened in the past because this was actually the focus of much of our work back around 2002. At the time we were rather relentlessly arguing in favor of commodity prices, the commodity cyclicals, and even the commodity currencies. At one time our upside targets for the Canadian and Australian dollar appeared to be so ‘high’ that they looked almost farcical. We were told, for example, if the Canadian dollar ever came anywhere near our upside target (which, we recall, was around .88 back when the currency was trading in the low .60’s) that the entire country would become bankrupt.
In any event… we have a tendency to be some distance ahead of the markets so after championing the commodity trend for a few years we moved on to new ideas. Bad choice. Especially in retrospect.
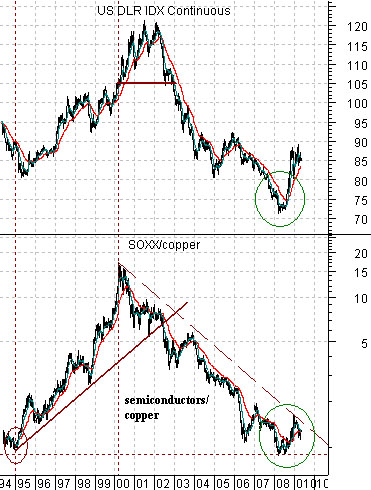
The trend from 2002 through into 2008 was most definitely ‘cyclical’ with the focus of ‘cyclical’ occurring through rising commodity prices. To explain how this worked on an intermarket basis we have included a chart below of the U.S. Dollar Index (DXY) futures and the ratio between the Philadelphia Semiconductor Index (SOX) and copper futures.
From 1995 into 2000 the trend was ‘consumer’ and the driver was the U.S. dollar. In other words economic growth was focused on consumer-oriented products and services in a manner that drew capital towards the U.S. dollar. Fair enough.
From 2002 into 2008 the trend was ‘cyclical’ and the driver was a weak U.S. dollar. Growth was focused more on the producer than the consumer in a manner that drew capital away from the U.S. dollar. Once again… fair enough.
We will argue that ‘tech’ is a consumer-oriented cyclical while ‘commodities’ are producer-oriented. In other words in a markets cycle that includes strength in the consumer sector relative to the cyclical sector along with a rising U.S. dollar one should own both consumer stocks (for obvious reasons) and consumer-oriented cyclicals (autos, airlines, and most especially ‘tech’).
When the trend is dominated by strength in the cyclical sector relative to the consumer sector- as was the case from 2002 into 2008- and the dollar is weaker then we get an entirely different kind of trend. Dollar weakness shows that money is flowing from the U.S. towards the smaller markets and it usually makes sense to ‘follow the money’. Since a weaker dollar will tend to go with stronger commodity prices and a weaker consumer vs. cyclical trend will favor ‘producers’ the best sectors will tend to be non- U.S. commodity producers or, we should add, almost anything that has anything to do with the production of raw materials.
Our final point is that we have no idea- as of yet- what the next trend will be but since we realize that once the ‘next trend’ begins it should run for the next 5 to 6 years… perhaps we have time to figure this one out. The dollar has been stronger and now is a bit weaker. The equity markets are still rallying on strength in the cyclicals and, similar to Japan, appear to only be capable of rising when interest rates are moving higher which is what happens when ‘cyclical’ is the dominant theme. As always… we will continue to work away until the picture becomes a bit less opaque.