We are going to attempt to deal with a rather complicated relationship based on the divergence between two cyclical markets back in 2002. Our view is that this may be relevant to the markets later this year and our conviction is that this may prove to be a particularly inspired piece of works. Stranger things have happened.
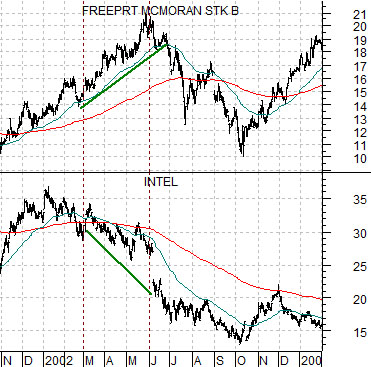
Our focus is on the time period between February or March of 2002 and the end of May. The chart below compares the share price of FreePort McMoRan (FCX) with that of Intel (INTC).
We have argued that cyclical is cyclical which simply means that economically sensitive sectors will tend to rise and fall at the same time. The twist is that strength or weakness in another market can create temporary divergences. Rising oil prices, for example, may hurt the airlines while falling grains prices could act as a negative for the fertilizer stocks.
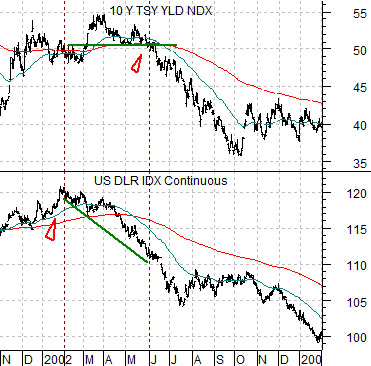
In any event… we add the comparison between 10-year Treasury yields (TNX) and the U.S. Dollar Index (DXY) futures to the mix. The chart below covers the same time frame as the comparison between FCX and INTC.
Through most of the 1990’s the broad stock market trend followed the dollar. The peak for the dollar was reached around the time that the Nasdaq made its bubble peak in 2000. Through late 2001 the trend favored the cyclical sectors as FCX and Intel moved upwards along with 10-year yields and the U.S. dollar.
A divergence began to build in early 2002 as the dollar began to weaken. This led to a falling share price for Intel even as FCX pushed higher. The argument is that the markets viewed dollar weakness as a positive for the commodity markets which led to higher prices for FreePort even as Intel traded lower. Put another way… while the stock market had been trending with the dollar when the dollar began to decline it led to higher prices for the miners even as the chip stocks were pressured lower.
The divergence continued for 3 or 4 months only to end rather abruptly in June of 2002. Our argument is that FreePort could continue to rally on dollar weakness as long as 10-year yields were not making new lows. Once yields declined below 5% FreePort broke to the downside with the correction continuing until yields had bottomed. As the dollar began to weaken a second time in October of 2002 the share price of FCX swung back to the upside even as the Intel’s recovery stalled at the moving average line.
We are going to attempt to put today’s first page observations into some kind of present day context. The argument would be that through the 1990’s the stock market trended with the dollar. A strong dollar trend will favor the tech and telecom sectors so even though the commodity producers performed nicely the dominant theme was ‘tech’.
The next part of the argument would be that following the stock market’s peak in 2000 and the ensuing recession the underlying trend for the markets changed. Instead of stocks rising with the dollar the trend shifted so that stocks rose when the dollar was falling. Instead of a trend dominated by tech and telecom the ‘weak dollar’ trend favored the commodity producers.
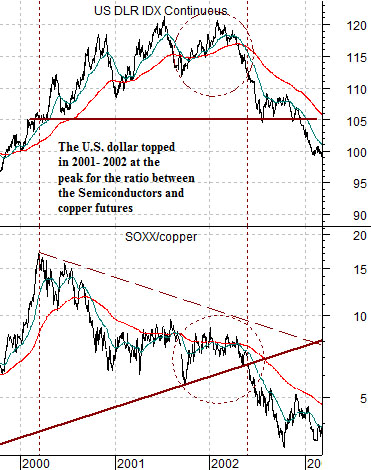
At top right we show the U.S. Dollar Index (DXY) futures and the ratio between the Philadelphia Semiconductor Index (SOX) and copper futures. The chart covers the time period through 2000- 2002.
When the dollar is trending higher the SOX will rise relative to copper. What we are attempting to show is the rather lengthy process that the markets waded through between 2000 and 2002 to change the underlying trend. The SOX/copper ratio peaked with the Nasdaq in March of 2000 while the dollar continued to push upwards for close to 2 more years.
The major change from strong dollar to weak dollar was made once the SOX/copper ratio broke down below its long-term support line.
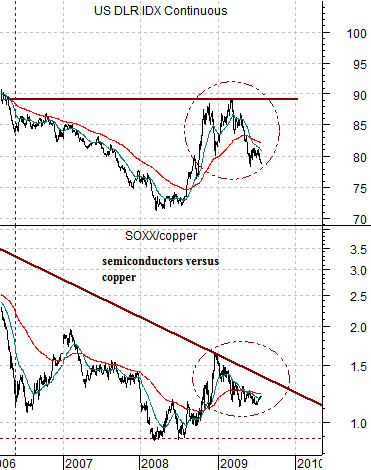
We show the same comparison for the current time frame at bottom.
The idea here is that the ‘beginning of the end’ for the strong dollar trend was reached in early 2000 at the peak for the SOX/copper ratio even though the dollar did not truly begin to decline until this ratio broke support in 2002.
The argument would then be that the ‘beginning of the end’ for the weak dollar trend would commence at the low point for the SOX/copper ratio- reached between the spring of 2006 and mid-2008 – but an actual stronger dollar trend would not begin in earnest until the ratio broke either up through trend line resistance or through the highs set in late 2008.
The first point would be that the decline in the SOX/copper ratio during the first half of 2009 concurrent with dollar weakness may be similar to the bounce in the ratio along with dollar strength through late 2001 into early 2002. We will focus on this detail on the third page.
The second point- returning the first page argument- is that if the trend changes from ‘commodity and weak dollar’ to ‘tech and strong dollar’ then… initial weakness in the commodity producers (i.e. FCX) in response to dollar strength would be similar to the way Intel began to weaken in early 2002. The tech sector (i.e. Intel) may be able to trend higher for several months once the dollar begins to rise.
The third point is that if the techs diverge from the commodity producers based on a rising dollar then a similar break point to 10-year yields falling below 5% in 2002 would be yields declining below roughly 3.3% this year. If the dollar begins to rise but yields hold above 3.3% we can make a case for a cyclical divergence that would favor technology at the expense of the commodity producers.