
By FXEmpire.com
Natural Gas Weekly Fundamental Analysis April 2-6, 2012, Forecast
Introduction: Natural gas is nevertheless a major commodity in its own right, which is used for everything from cooking food to heating houses during the winter. Natural Gas is growing much faster than either of its non-renewable fossil fuel competitors, oil and coal.
Do not miss the weekly U.S. gas inventories report. The figures are issued by the Energy Information Administration (EIA) every Thursday afternoon at 15:30 (released Friday at 15:30 if there was a U.S. bank holiday on Monday). Here’s a link to the latest EIA report. The main natural gas moving figure in there is the change in inventories from the previous week. When it comes to the gas inventories report, we’re talking about billions of cubic feet, Bcf for short.
When the actual change in inventories number is released, it is the deviation from the expected number that is really important. If the actual inventories figure shows a 24 Bcf rise when an 84 Bcf increase was expected, then that is actually positive for the price of natural gas. All else equal, the price of natural gas should rise after the release.
A barrel of oil has roughly 6 times the energy content of natural gas. If the fuels were perfect substitutes, oil prices would tend to be about 6 times natural gas prices. However, due to various market characteristics discussed briefly above and the ease of using oil, the price of oil has been following a pattern of 8-12 times that of natural gas. However that ratio has spiked dramatically since March 2009.
Analysis and Recommendation:
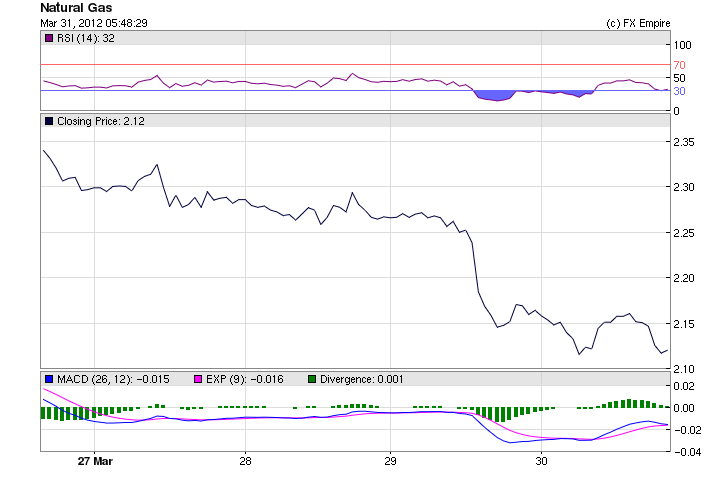
Natural Gas fell to a record low, of 2.1135 and is currently trading at 2.12 after a drop from the high of 2.4190. With the end of winter, an early and warm spring, there is no demand for NG for heating purposes. Inventories this week were far in excess of forecast, leaving a glut in the marketplace with little demand to use up the high inventories.
Working gas in storage was 2,437 Bcf as of Friday, March 23, 2012, according to EIA estimates. This represents a net increase of 57 Bcf from the previous week. Stocks were 816 Bcf higher than last year at this time and 900 Bcf above the 5-year average of 1,537 Bcf. In the East Region, stocks were 403 Bcf above the 5-year average following net injections of 25 Bcf. Stocks in the Producing Region were 392 Bcf above the 5-year average of 627 Bcf after a net injection of 34 Bcf. Stocks in the West Region were 104 Bcf above the 5-year average after a net drawdown of 2 Bcf. At 2,437 Bcf, total working gas is above the 5-year historical range.
Working gas stocks in the Producing Region, for the week ending March 23, 2012, totaled 1,019 Bcf, with 249 Bcf in salt cavern facilities and 770 Bcf in nonsalt cavern facilities. Working gas stocks increased 17 Bcf in the salt cavern facilities and increased 18 Bcf in the nonsalt cavern facilities, since March 16
Historical:
High 5.13 January 2011
Low 2.1135 March 30, 2012
Economic Events: (GMT)
WEEKLY
-
Heating Oil & Propane Update (October-March)
Heating Oil, Propane Residential and Wholesale Price Data
Release Schedule: Wednesday at 1:00 p.m. EST -
Natural Gas Weekly Update
Release Schedule: Thursday between 2:00 and 2:30 p.m. (Eastern Time) -
Weekly Natural Gas Storage Report
Release Schedule: Thursday at 10:30 (Eastern Time) (schedule)
Originally posted here

