
The S&P 500 cash index (SPX) closed at 1403.36 on Friday, up 24.83 points for a net weekly gain of 1.8%.
Last week the SPX ended solidly higher. The market ignored the Spanish debt downgrade, a disappointing unemployment report, and lower than expected GDP data. This disregard of bad news was based on hopes for a QE3 intervention from the Federal Reserve, triggered by a statement from the Fed that it will “act if needed” in order to bring down the unemployment rate to between 7.8 to 8 % by the year end.
So bad news – increased unemployment, sagging economic data – raises the hopes of traders that the Fed will intervene to flood the market with liquidity, boosting stock prices. Bad news in the real economy is thought to be good news on Wall St.
This week, US economic data will continue to be the key factor in speculation about the Fed’s next step. If Non-Farm payroll data this week is good, the SPX may sell off. If it is bad, it will continue to favor QE3 and push SPX higher.
SPX Weekly Chart
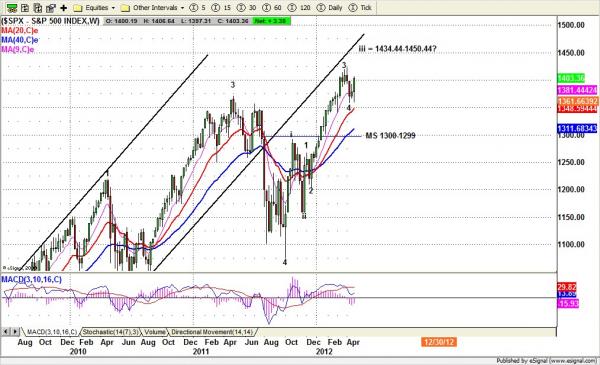
Technical analysis
Based on the weekly chart (above), the 1357 level could be a short-term bottom and the mini-correction by the SPX may be complete.
The next step for the SPX could be a bounce up to 1422 area for testing or higher to 1434.44-1450.44 to shakeout shorts before it pulls back down again.
Based on Wave principles, SPX closed above the 1400 level, indicating that the short-term correction has been completed and the next sub-wave 5 of wave iii is in process.
The sub-wave 5 top in the 1434.44-1450.44 range could be the next upside target, as long as last Wednesday’s low 1372 area holds the SPX up.
However if SPX breaks below 1368 line, then 1354-1342 range may be retested once. There is less support for this hypothesis in the daily chart.
To see the full analysis, plus the weekly ouitlook for gold, oilo, bonds and the Euro, visit www.naturus.com

