U.S. equities declined for the fourth consecutive day as the European Central Bank failed to reassure investors with regard to its near-term plans to stimulate economic growth. Or something like that. Frankly we suspect that many were prepared to sell the news either way.
The problem with the equity markets at present is that they are not really ‘low’ enough to make one wish to jump in, not high enough to suggest that it is time to bail out, yet still stuck within a choppy but bullish price trend.
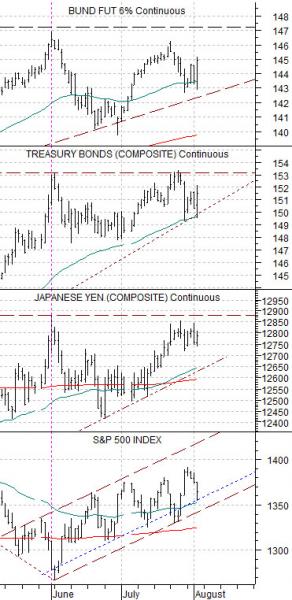
Below is our chart of the German bund futures, U.S. 30-year T-Bond futures, Japanese yen futures, and S&P 500 Index (SPX).
The ongoing argument has been that the trend for the S&P 500 Index turned positive at the end of May when the U.S. and German bond futures reached a peak. This was confirmed by similar highs set by the Japanese yen.
The bond market and yen are destinations for capital ostensibly fleeing risk. One might argue that any market that rises relentlessly or even parabolically as a result of money moving away from risk becomes as risky as the sectors that money had been moving away from but that is a story for another day. The point is that each time bond prices and the Japanese yen ramp to new highs it represents an incremental level of ‘crisis’ for the cyclical trend.
We have argued that a long as bond futures prices were not spiking to new highs the trend for the S&P 500 Index would be positive. Not sharply positive but, perhaps, more ‘choppy positive’. Through June and July the SPX made a series of higher highs and higher lows as prices moved upwards through the trading channel.
The point is that through trading yesterday nothing much had changed. The U.S. and German bond futures were still trading below the highs set in May while the Japanese yen was also now worse than flat over the past two months. A ‘flat’ bond market and yen was expected to create a rising trend for equities with outperformance by the consumer and defensive sectors. The cyclical sectors will remain under pressure until the bond market’s trend finally completed the process of moving from ‘up’ to ‘flat’ and then to ‘down’.
Equity/Bond Markets
In yesterday’s issue we attempted to show the way that cyclical asset prices lag the direction of the bond market by roughly two years. This is an argument that we have made on many occasions over the past decade or so.
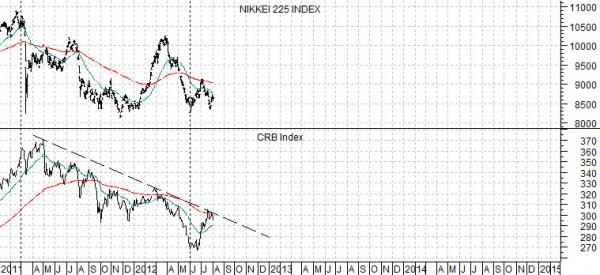
We started off by making the case that commodity prices trailed the bond market and then shifted our focus from commodities over to the Japanese equity market. Our fixation with the trend for the Nikkei 225 Index has much to do with something that we call the ‘Decade Theme’ but since we did not go into our explanation it seemed only fair to re-do the comparison to include commodity prices.
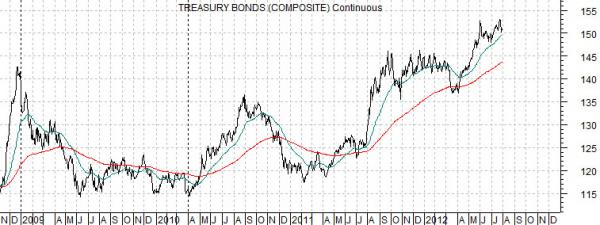
In any event… below is a chart of the U.S. 30-year T-Bond futures along with a comparative chart of the Nikkei 225 Index and CRB Index.
The key here is that we are showing bond prices from the end of 2008 to the present day and then comparing this with the Nikkei 225 Index and CRB Index with an offset or ‘shift’ of roughly two years. We use the term ‘roughly’ because the actual shift is 26 months.
From time to time we will write that ‘cyclical is cyclical’ which is a somewhat trite way of stating that most economically sensitive asset price sectors trend in the same direction at the same time. This is not always obvious, of course, because extreme strength in one sector can create the impression of weakness in another. Strong and rising oil prices will act as a negative for the autos and airlines while a pause for energy prices will allow these sectors to take a turn ‘catching up’.
The point is that any argument that we make based on the 2-year lag for the Japanese stock market also applies to the commodities markets. When prices do turn higher one or the other will outperform but for now both are still grinding lower. Eventually, of course, the strong and rising trend for bond prices that dominated 2011 and at least the first half of 2012 will create an upward bias for the cyclical trend. There are better days ahead.