Current crop conditions continue to deteriorate in the Midwest, with no relief in sight. While it is easy to make predictions, we feel it is more important to look at actual numbers than to pontificate about what could happen. In this article we attempt to explain where we have been, where we are, and where we might be headed in regards to the supply and demand numbers for corn in the 2012/2013 crop year.
The current drought and heat are not unprecedented for crop development. In 6 of the last 41 years corn and soybean trend line yields have fallen 10% or more due to excessive heat or lack of moisture. Unfortunately, this years weather is quite similar to that of 1988 in which both heat and lack of moisture are a factor. Actually the first half of 2012 will go on record as the warmest in the US since they started keeping national statistics in 1895. Furthermore the chart below gives one an idea of moisture conditions across the grain belt:

It doesn’t take a rocket scientist to figure out that it’s hot and dry. But it is important to understand the extremities that are actually occurring.
Corn is currently in the worst shape since it tassels/silks (pollinates) before beans. Once that phase is over the crop is basically “made”. As of July 15th the following key corn belt states saw the silking stage as follows:
- Illinois 93%
- Indiana 79%
- Missouri 88%
- Iowa 74%
Clearly the majority of the crop is near the end of this phase with no end to harsh conditions in sight. That said, we also must remember that genetic improvements over the years have developed more resistant strains of field crops, and that harsh conditions will not be as oppressive to production compared to even just 10 years ago.
To reach trend line yields corn needs 1/3″ of moisture per day during this period. Actual precipitation has been and looks to be well below that throughout the corn belt. This has been accompanied by record heat.
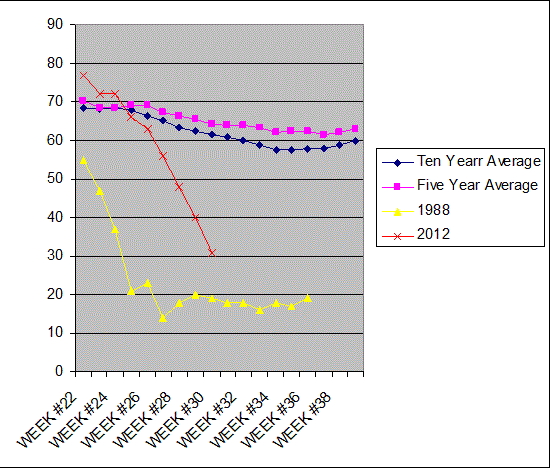
Reports coming out of the southern half from insurance estimators suggest that millions of acres will be abandoned. My sources are telling me that many fields south of I-70 (Northern Nebraska, Central Missouri, Southern Illinois, and Central Indiana and Ohio are being plowed under). Below is a chart of good to excellent conditions for corn for the current crop year compared to the five, ten year average, and 1988:
CORN-GOOD TO EXCELLENT
CONDITIONS

Conditions for the 2012/2013 crop are quickly approaching 1988 levels. If we look at the 85 bushel/acre yield for corn in that year, and add to it the 45 bushel/acre increase that should be expected from genetic improvements (that’s why its called trend line yield), we can eyeball a guess of this years harvest at roughly 130 bushels an acre (This is fast and dirty method of a calculation and not necessarily accurate. It is used as a way to get some idea of what one can expect from drought stricken production)..
USDA has pegged total area planted this year at 96.4 million acres. Analysts are saying that actual harvested acreage this year will be the lowest in 5 years. That would mean less than 86 million acres, a 10 million acre drop from USDA projections. At 86 million acres and 130 bushels an acre, production would be 11.180 billion bushels. If analyst are wrong and only 2 million acres are lost, total harvest would be 12.530 billion bushels (its amazing how much corn we produce, isn’t it?). USDA has also estimated about 900 million bushels left over from last years crop.
The USDA has also projected corn usage for the 2012-2013 crop year as follows (in millions of bushels):
Feed & Residual 4,800
Food, Seed, & Industry 6,320
Exports 1,600
Total Use 12,720
If actual crop abandonment is just 2 million acres and our yield estimates are in the ball park, there will be a deficit of 210 million bushels (12.530-12.720= -210 million bushels). If we assume field loss at 10 million acres however, there becomes a deficit of 1.540 billion bushels (11.180-12.720=-1.540 billion bushels). Pipeline minimum (the amount that the whole system needs in transportation channels without the whole thing collapsing) is about 600 million bushels. It is obvious to see price has to ration demand by moving up. We now have reached the traders conundrum. How high is high?
Our research based on chart patterns puts the initial price projection at $8.55. This is based on the mid-point gap left over from July 4th, and other proprietary analysis. Our secondary objective points to the $9.50 level.
While one cannot predict the future, given these facts we believe that there is still a big potential upside in the price of corn. The issue we actually find most compelling is that speculator participation is very low. The open interest in corn at the Chicago Board of Trade recently reached the lowest level since the end of 2009 and has only increased marginally since. This means there is still a huge source of potential buyers waiting in the wings. There are no guarantees in the futures market. At the same time we believe our analysis make a clear picture that corn prices are probably going higher.
RISK
DISCLAIMER:
The risk of loss in trading futures and options can be substantial. One should carefullyconsider their financial position to determine if futures trading is appropriate. Past performance is not necessarily indicative of future results.


