At this time of year we always get the sense at the start of the day that something important might happen… but it rarely does. As we mentioned a few weeks ago there have been Augusts that have included important trend changes- the start of the equity bull market in August of 1982, the pre-crash peaks in the S&P 500 Index in 1987 and the Hang Seng Index in 1997 come to mind- but in most instances the days seem to slide by without much actually changing.
We are going to start things off today with a couple of rather messy charts as we attempt to bolster a case that we have already spent quite a bit of time on. Perhaps too much time.
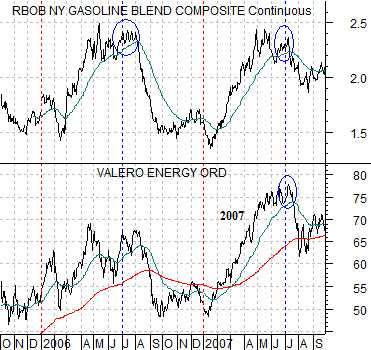
Below is a chart from 2005 into the autumn of 2007 of gasoline (RBOB) futures and the share price of oil refiner Valero (VLO).
This has nothing to do with the current situation. We are simply showing this to make an argument about ‘time’. Valero tends to trend with gasoline prices so when gasoline prices rise the markets seem to view the refiners in a more positive light. Eventually, of course, gasoline prices decline but in a world where a 2-quarter trend in one direction is investment ‘nirvana’ that hardly seems to matter.
The argument is that in the not so distant past the cyclical trend ran positive for the first two quarters of the year and then negative for the final two quarters. Gasoline prices were stronger through the first half of 2006 with Valero rising from close to 50 up to 70 and then were stronger during the initial six months of 2007 as Valero trended up from 50 through 75.
In most recent years the cyclical trend has shifted by a quarter. Instead of strength from January through June we have seen something closer to a rising trend from October through March.
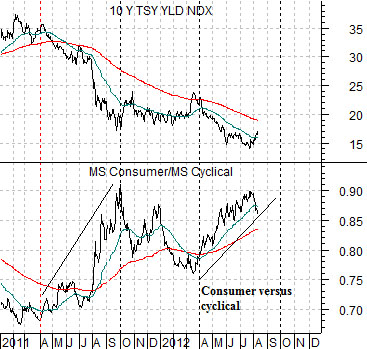
Below is a chart of 10-year Treasury yields and the ratio between the Morgan Stanley Consumer Index and Cyclical Index. The consumer/cyclical ratio tends to rise when yields were moving lower and then decline when yields are moving upwards.
The point? We are currently working on a negative cyclical trend that began around the end of March. If history were to be kind enough to repeat this will continue through September.
Equity/Bond Markets
Every markets cycle feels wholly unique. Every investment time frame seems to be completely different than anything that has happened in the past. The markets seldom repeat exactly. Yet… they do repeat but only with enough differences to make the repetition hard to spot.
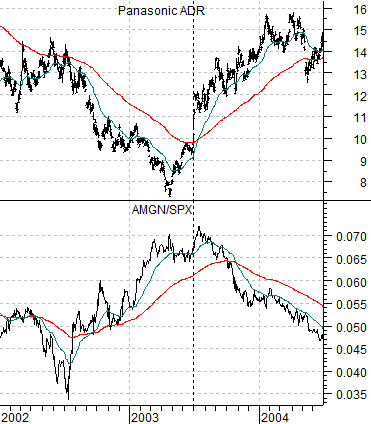
Next is a chart of Panasonic (PC) and the ratio between Amgen (AMGN) and the S&P 500 Index (SPX) from 2002 through the first half of 2004. This is the time period that includes the tail end of the 2001- 2002 equity bear market/post-Nasdaq collapse and the early stages of the subsequent bull market.
The argument is that late in the bearish trend the market begins to shift strength over to the biotechs. The non-cyclical growth characteristics of these stocks tends to increase in value as investors become increasingly disenchanted with the prospect for any kind of economic growth.
We are using Panasonic to represent ‘cyclical’. We are using the AMGN/SPX ratio to represent the offsetting shift away from the cyclicals during the late stages of the bearish trend.
Notice how the AMGN/SPX ratio did not peak until just after PC moved above its 200-day e.m.a. line. Strength in PC indicated impending bond price weakness and the start of a cyclical recovery.
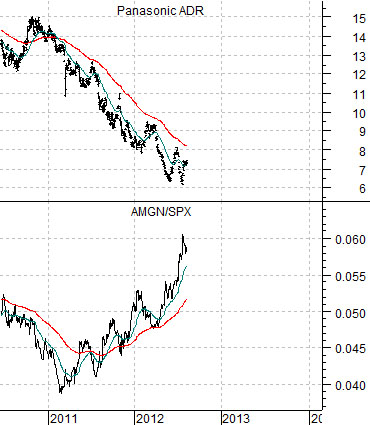
The current situation is shown below right using a much longer time frame (i.e. this is taking forever to play out). The AMGN/SPX ratio has been on the rise since the oil stocks started to weaken in the first quarter of 2011. Panasonic has rallied sharply on a few occasions only to fail at or near the 200-day e.m.a. line.
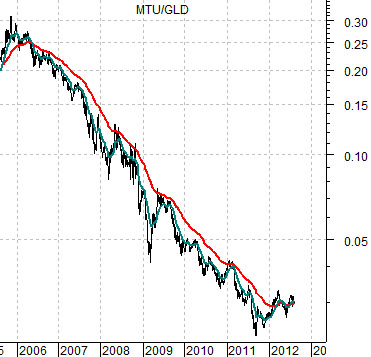
Below is a ratio between Japanese bank Mitsubishi UFJ (MTU) and the gold etf (GLD). Our point is that… the markets are getting ‘there’. The negative trend that began in 2006 that pushed the cyclical financials (MTU) lower and gold (GLD) higher has run out of bearish momentum as the moving average lines for the MTU/GLD ratio struggle to cross back to the upside. Our view is that we were late in the bearish trend but have not yet seen the kind of strength in PC and MTU that one would expect at ‘the turn’.