We are going to do something a bit different today. Usually we make an attempt to answer the questions that we raise but in this instance it might work better if we simply focus on the question itself. Let’s see if we can make this work.
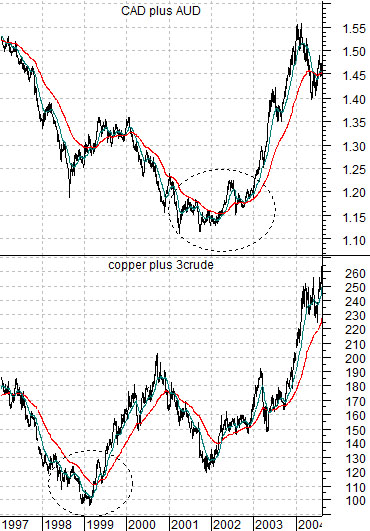
Below is a comparative chart from 1997 into 2004 of the sum of the Canadian and Australian (CAD plus AUD) dollar futures and the combination of copper futures (in cents) and crude oil futures (in dollars multiplied by 3).
Very quickly… for reasons we won’t bother going into we decided years and years ago that copper in cents was the rough equivalent of crude oil in dollars (times 3). The peak for copper in 2008 was just over 4.00 (400) while the high for crude oil was roughly 147 (i.e. 441).
The ‘Decade Theme’ argues that crashes and crises show up in the ‘7’ and ‘8’ years while cyclical bottoms are made in the ‘2’ year.
We have argued that crises are ‘trend changers’. They mark the end of a trend and the start of something new. The Asian/LTCM/Russian/Brazilian crises that roiled the markets from the late summer of 1998 into February of 1999 created the bottom for copper and crude oil prices.
The markets rebounded in 1999 and then slumped back in an ‘echo bear’ through much of 2000 and 2001. The 1998- 99 ‘crisis bottom’ was followed by the 2002 ‘cyclical bottom’.
So… the question is… what markets or sectors in the current situation fit into these two categories. Obviously 2008- 09 included the subprime crisis while we have argued rather extensively that 2012 will give us the cyclical bottom.
Investors keep running back to the old themes but the idea is that something and, perhaps, everything is in the process of changing as we move deeper into 2012. The subprime crisis was the equivalent of 1998’s Asian crisis while the Eurozone problems replicate the tech and telecom bear market bottom of 2002. But… if we assume that the markets never do the same thing twice in a row… then what are the ‘copper and crude oils’ for this decade? Which currencies will start to rise as the direction of the flow of capital changes? We have had the crisis and are making the cyclical bottom so what happens next?
In the short run there are definite signs of an improving cyclical trend as Treasury yields rise along with certain cyclical asset prices. Over the longer haul, however, the picture is a bit more negative.
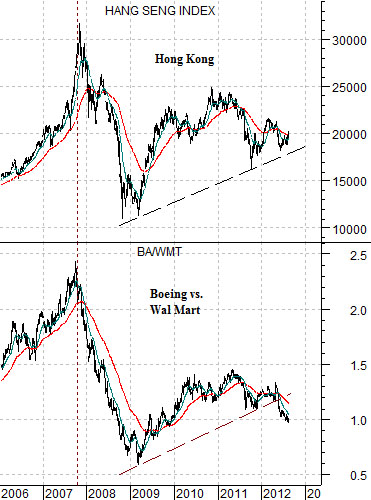
Next is a comparison between the Hang Seng Index from Hong Kong (a notoriously cyclical market that trades closely with copper prices) and the ratio between Boeing (BA) and Wal Mart (WMT).
The BA/WMT ratio peaked along with cyclical growth in the autumn of 2007 and continued to decline even as rising commodity prices created the impression of relentless strength. While it may not be terminal… the ratio has been weak enough since the spring of 2011 to at least suggest that there are still problems out there.
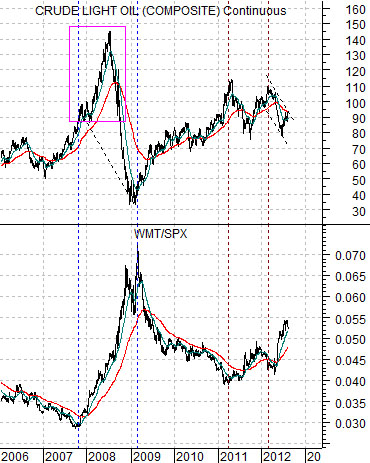
Below is a view of crude oil futures and the ratio between Wal Mart (WMT) and the S&P 500 Index (SPX).
This is another spin on the original argument. When Wal Mart starts to strengthen against companies like Boeing as well as the broad market it tends to mean that growth is weakening. Notice that crude oil prices spiked upwards for a full nine months into 2008 before collapsing. This suggests (to us) that divergences will generally be resolved in favor of the WMT/SPX ratio. Another example, by the way, was the rising trend for the WMT/SPX ratio from the start of 1997. The Hang Seng Index ‘crashed’ nine months later with the Asian crisis marking the end of the trend later in 1998.
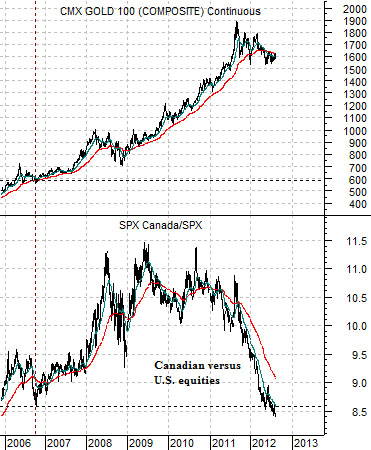
Last is a chart comparison that we have tossed in… just because. The Canadian dollar remains stronger but beneath the surface things aren’t quite so positive. The ratio between Canadian and U.S. equities has been in a virtual free fall since 2011and is now beneath the lows set in 2006 when gold futures prices were closer to 600.