
By Paul Gabrail
The last twelve years has seen the S&P 500 go from a high of 1552 in March of 2000 to a current level of 1404, as of this writing. Yes, if you factor in dividends, the stock market has made money over the past twelve years, but to see negative nominal growth is still frustrating. To have this happen for such a long period of time makes us all realize that we are in a secular bear market, which is a long term downward or horizontal movement in the market. If you put inflation into the equation, your money in 2000 was worth considerably more than it is today, which is a double whammy after getting no nominal growth in that time period.
This is one of the many things we discuss at MGO with our Chief Investment Officer, Michael Moskal. It is a constant topic of conversation due to the fact that we manage about $500MM in total assets and we always have clients anywhere from factory workers to CEOs wondering how their 401(k) and managed accounts are doing.
Of course, many financial planners and wealth managers will argue that we have made it through the crap of 2008 and that we are on our way to new highs. Well, apart from the fact that if they didn’t say that, they may lose clients, this is somewhat erroneous based on history. While that MAY be true, history has proven to show otherwise. Let’s first discuss the non-data related information.
The average secular bear or bull market lasts 17 years. Since 1877, here are the secular highs and lows (adjusted for inflation) to show the kind of returns we have seen (this information is pulled from DShort.com).

As you can see, the time frames have been pretty wide ranging but the one of concern to me is the 1929 crash that didn’t yield a start to the new secular bull market until 20 years later. The 1929 crash was one that was caused by similar financial circumstances as the 2008 crash we had recently as well as the irrational exuberance we experienced in 2000 from the technology sector. Also, as you can see, the March 2009 low was 59% below the secular bull peak of 2000…in relation to other levels we have hit in the past, it is the second lowest dip. Now, does that say anything really? Not really, but why would one of the biggest peaks and crashes in history “only” yield a 59% drop when others have been well over 60% and the most comparable crash even reaching 81%? Again, it is speculation, as is most market timing, but still interesting to look at.
Another interesting factor to assess where the market would have to go before we hit a bull market: The 10 Year Price/Earnings Ratio. This is a calculation of the average P/E of the last 10 years. It was created to even out the highs and lows of Price/Earnings ratios over a 10 year period to see a longer term health of the market. Right now, our 10 YEAR P/E ratio is at 20.9 as compared to a historical average of 16.4. This is a cause for concern because even at the “bottom” of our crash in March of 2009, the 10 YEAR P/E only hit 13.3, which was still below the historical average, but not quite as impressive when you see that we lost 50% of our value so quickly.
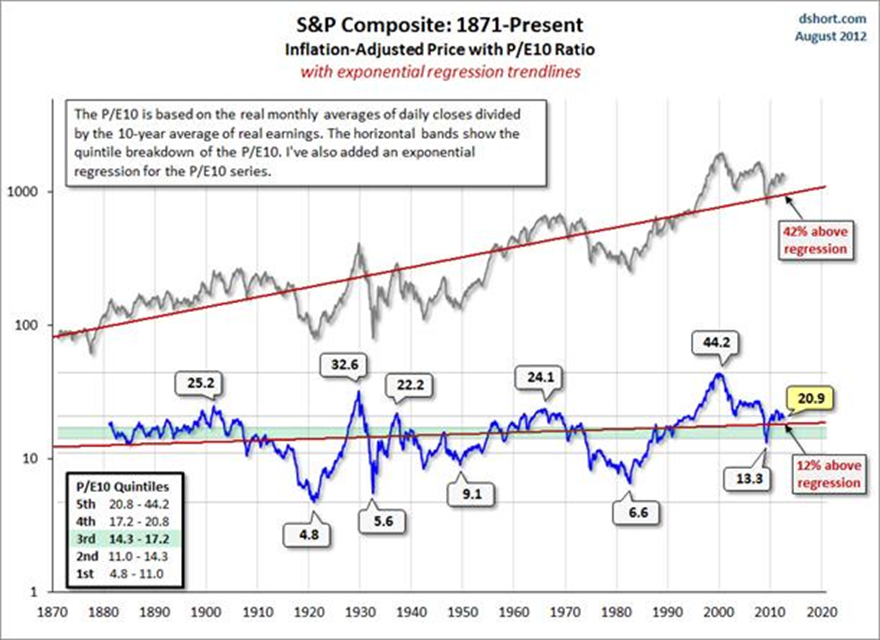
The actual interesting point in this analysis is that in all the secular bear market bottoms in 1921, 1932, 1942, and 1982, the 10 YEAR P/E hit single digits (less than 10). We are currently at 20.9! So does this mean the market has to fall in half again? The bull market analyst would say that earnings can just increase to eventually even this out, but that never happens. It will probably be a combination of both earnings increasing over the next few years as well as the stock market oscillating in a certain range of pricing.
Now, if you look at the current Trailing Twelve Month P/E Ratio, it currently sits at 14.9 which is below the historical average of 15.1. This is a positive for the bulls but it doesn’t mean that you’re going to make crazy money investing today. The good news I see from this is that if you are looking LONG TERM, you will probably do pretty decent over a 20-30 year period if you invest dollars today. The other information I stated above tells me that you should be expecting some peaks and valleys along the way, but again, if you’re in it for the long haul, don’t worry. It will work out in the end. Keep buying high dividend paying investments so that you can get some returns from the companies you invest in apart from the emotional ups and downs of the stock market.
From all indications we can see, I wouldn’t be able to say when a new secular bull may start, or even if it hasn’t started yet. All I can say is that I personally don’t have 100% of my money in stocks, but I also don’t have 25% in stocks. I have a nice blend of stocks, cash, and bonds, even though I am able to weather the long storm of up and down markets.
About the Author:Paul Gabrail has been investing since he was 13 years old. He specializes in real estate and co-owns over 800 rental unit properties and $60 million in assets. He blogs at www.thecapitalistmanifesto.com.
The views and opinions expressed herein are the author’s own, and do not necessarily reflect those of EconMatters.
(C) EconMatters All Rights Reserved

