

Across the bottom on the front cover of the original book on Market Profile, Markets & Market Logic, authored by J. Peter Steidlmayer and Kevin Koy is the following, “Sponsored by J.F. Dalton Associates.” At the end of our first meeting, which lasted for less than 15 minutes, Pete walked to the elevator, turned and asked me if I wanted to sponsor his book for $10,000. My immediate response was yes.
That was clearly one of the best intuitive decisions I have ever made. This article explains why I made that decision and why I would make the same decision today even though Pete has shifted his emphasis away from time and toward volume.
TIME IS THE CONSTANT
What initially intrigued me was the idea of making time a constant. With time as a constant you had a reference against which you could better analyze the market’s two-way continuous auctions. Time allowed a more contextual view of the market.
For example, a news item that stated that GM sold four million cars isn’t very meaningful. However, saying that GM sold four million cars in the first quarter of 2012 is far more relevant.
GM pastes a sticker on each car listing its equipment and the final manufacturer suggested retail price. Seldom does an automobile sell for the price listed on the sticker. Price is just an advertisement. GM constantly analyzes how many cars–volume–were sold in a ten-day period and at what price; how many cars were sold in 5 ten-day periods, 10 ten-day periods, etc.
THREE KEY COMPONENTS FOR A TRADE
Any transaction that is financial in nature is comprised of three components:
1. Price advertises opportunity.
2. Time regulates all advertised opportunities and,
3. Volume measures the success or failure of those advertised opportunities.
THE DEBATE
Currently, there is debate whether to employ a traditional TPO (time price opportunity) profile or a volume profile. This is unfortunate as it is the combination of time and volume that yields the most valuable analytical information as shown above in the GM example.
There is a constant tendency to want to simplify the process around which trading decisions are reached. Focusing on volume does simplify that process. However, focusing on volume alone is too limiting to address the complexities of trading and human behavior. There is, in fact, only one real constant; that constant is time. Each 30 minute period, single day, week, or month is constant.
WHAT IT SHOWS
It is the plotting of price, a variable, against time, a constant, that yields market structure. Market structure reveals both:
o Patterns of human behavior
o Repeating patterns of change
MARKET PROFILE IN ACTION
Let’s review a pattern of human behavior that is captured by the traditional TPO Market Profile. Take a look at Figure 1 below: E-Mini S&P 500 May 3, 2012–The Short Trap.
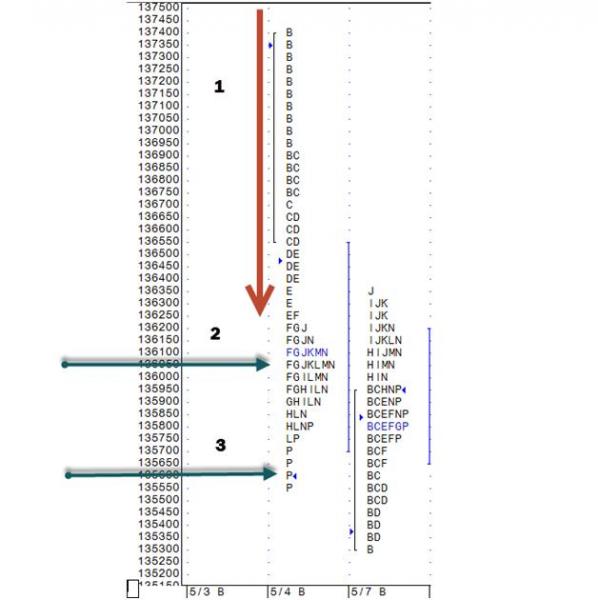
1. Aggressive selling from the opening bell.
2. The POC (point of control) or widest point on the Profile reading from left to right. This is the price that was traded over the longest period of time on May 3, 2012. The objective of any market that is financial in nature is to seek a level where two-sided trade can occur. In the above example the POC identifies the level at which the market is attempting to come into balance. The POC is the “fairest price at which business is being conducted”; it is where price traded most often.
3. The settlement price for the day is far below the fairest price; traders are selling futures below the fairest price of the day. This is referred to as selling ‘short-in-the-hole’ or selling short below value.
AVOID THE SHORT TRAP
On the following day price opened lower and spent most of the day rallying. The pattern reflected via the traditional Market Profile above told informed traders that the market inventory was too short relative to the POC or fairest price. The information was there to help traders both avoid the “short trap” and to take advantage of the inventory imbalance for a long trade.
PROFILE CAN REVEAL
The short trap example above is only one of the many repeating patterns of change made possible through the traditional Market Profile. Others include:
o Markets that are too long.
o Markets that have high odds of continuation.
o Markets that have increased odds of reversals.
o Markets that are in balance with limited opportunities.
o Markets that should be traded early.
o Markets that you should let “shakeout” prior to entering.
BOTTOM LINE
The traditional Market Profile estimates volume via the formula Price X Time = Volume. While it is not exact it does a good job of incorporating volume into the Market Profile while also conveying the equally important component of time.

