The month of September is shaping up to be somewhat challenging for the cyclical sectors. The ‘stop’ on this particular observation is 30-year Treasury yields rising above 3.0%.
The arguments are as follows:
First, trends tend to run quarter to quarter. In the absence of something rather unexpected (like a sharp drop in the weekly U.S. jobless claims numbers below 350,000) we should expect ‘more of the same’ until some time early in October.
Second, the seasonal trend tends to create the impression of weaker growth into the autumn and robust strength into the spring. The pivot points are typically October and November for the lows and May and June for the highs. From year to year the seasonal trend will impact the markets in different ways depending on the market’s view on the benefits of growth. If, for example, the primary concern is inflationary pressures then slower growth can be a positive. Most of time, however, cyclical and bear market bottoms are made in the month of October.
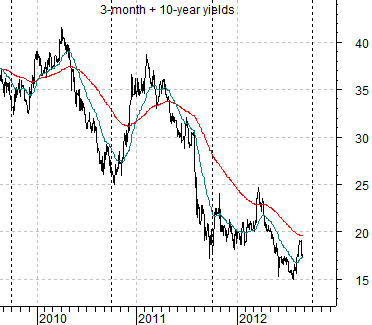
Below is a chart of the sum of 3-month and 10-year Treasury yields. Notice that the lows for interest rates were made around the end of the third quarter in 2009, 2010, and 2011. This is a fine example of the seasonal trend at work.
The point is that there is a reasonable chance that September is going to be a gloomy month as we work towards a cyclical bottom into the final quarter of this year.
Our thought is that pressures through September will come from a weakening trend in China. We will attempt to show why on the following page.
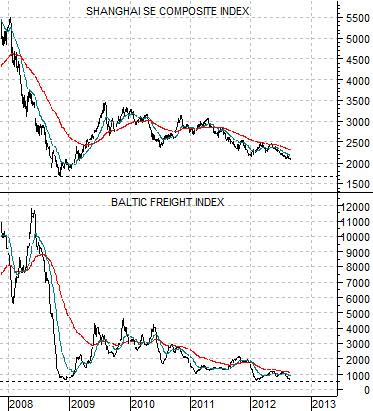
Next is a comparison between the Shanghai Composite Index and the Baltic Dry (Freight) Index. The Dry Index represents ocean freight costs for dry bulk cargo and this is often a reasonable surrogate for the vibrancy of global trade.
The argument is that the Baltic Dry Index has settled back to the lows made in late 2008. A similar decline by the Shanghai Comp. would pull it back towards the 1700- 1800 level.
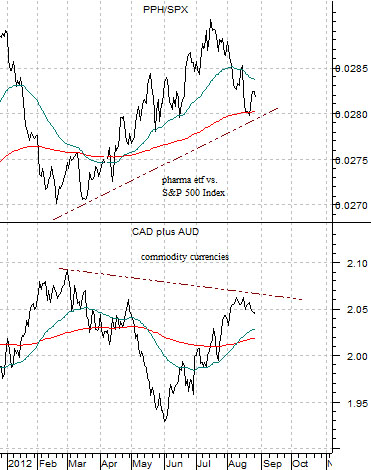
The chart just below compares the ratio of the pharma etf (PPH) to the S&P 500 Index (SPX) to the sum of the Canadian dollar (CAD) futures and the Australian dollar (AUD) futures.
Let’s set the premise.
The commodity currencies (CAD plus AUD) trend with commodity prices. When the currencies are strong and rising it means that money is moving towards the kind of themes that dominated the past decade. These themes are… energy and basic materials.
The offset to this trend is represented by the health care sector including the drug stocks.
The commodity cyclicals go with rising interest rates as well as a weaker U.S. dollar.
The pharma stocks do better with declining interest rates and a stronger U.S. dollar.
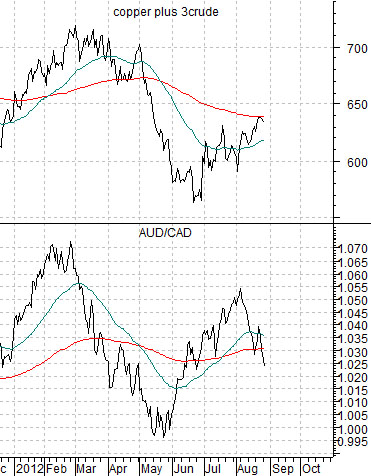
Below is a chart of the sum of copper (in cents) and crude oil (in dollars times 3) as well as the cross rate between the Aussie dollar and Cdn dollar.
The AUD/CAD represents the relative strength of ‘China’. China may be a bit narrow but the argument is that Australia is leveraged to commodity prices and geographically closer to China. Canada, on the other hand, is also leveraged to commodity prices but is more closely tied to conditions in North America.
Both the CAD and AUD trend with commodity prices but the AUD will tend to be stronger when Chinese growth is viewed as positive. For much of the past decade the underlying or dominant trend within the markets has been based on economic expansion in China which has tended to push the Aussie dollar higher.
So… let’s put together a bit of an argument. Notice that the AUD/CAD cross rate has been declining through the month of August.
The weaker AUD/CAD suggests that economic activity in China may be slowing. Obviously this is a small sample size but the direction of the flow of money over the past few weeks certainly hints at this kind of outcome.
If China is slowing then the AUD/CAD should decline. The sum of the CAD and AUD should also decline as both currencies resolve to the down side led by weakness in the AUD.
If the commodity currencies are weaker then the pharma stocks should continue to outperform the broad U.S. stock market.
If trends run from quarter to quarter with cyclical bottoms made in the autumn then the window for some kind of sell off for crude oil and copper would extend from roughly today through into the middle of October.
The point? Unless 30-year Treasury yields show an inclination to move above 3.0% it makes sense to remain defensive through the balance of the current quarter.