

Building a successful trading strategies is often a difficult and time consuming process and there is not a single statistic available to see how good it is. Instead, it requires looking at several metrics.
TradeStation provides a wonderful platform for building and testing your ideas but the end result however must be derived from the strategy performance report. This provides an abundant supply of metrics but not one will cover all bases. That is because there are so many different measurements that need to be “good” for the strategy to be good.
GETTING STARTED
Net profit is often the first thing a trader looks at when examining the performance report. Net profit number does not account for drawdowns. The profit factor will often be best with the fewest trades. The ratio average win/average loss and percent profitable metrics ignore profitability and drawdowns altogether.
The Sharpe ratio is easily fooled simply by over-leveraging the strategy to the point where the risk free rate-of-return is miniscule compared to the monthly returns. The RINA index ignores the impact of one big winner skewing results. The bottom line is there is no good choice when it comes to relying on just one statistic to allow you to compare strategy performances.
A GOOD STRATEGY
To be fair, we need to define what constitutes “goodness” in a strategy. Here is my list of good performance features of a strategy.
o High net profit
o Lots of trades
o No outlier big win trade
o High percent of profitable trades
o Small drawdowns
o Short drawdowns
o Staying in market as little as possible
o Smooth equity curve
The PRRR METRIC
It’s asking a lot for one metric to account for all of these things and the Pessimistic Return-to-Risk Ratio without the single biggest winner (PRRR_NoBigWin) delivers all of these things. It is one statistic that takes into account all of the features we want in our performance list. It accounts for the problems of one big winner, too few trades, big drawdowns, extended drawdowns and staying in the market too long. All of this gets wrapped up into a statistic that eventually will guide you to the best performing strategy with the best set of parameters.
Code for the user function is provided on my website. The result of this computation is to produce a ratio for the adjusted return divided by the adjusted risk. Adjustments are made for too few trades, outsized winning trades, big drawdowns, and length of time in drawdowns.
COMPUTING PRRR
We begin by computing the numerator of the PRRR. This is an adjusted net profit computation that penalizes the returns for small numbers of trades by de-emphasizing profit from winners and emphasizing losses from losers. The impact gets more severe for strategies taking fewer trades.
Then the denominator of the PRRR is computed. This is the risk side of the equation where an adjusted average drawdown is computed. The computation increases the denominator for big drawdowns and also for extended time in drawdowns.
The PRRR is the ratio of the adjusted return divided by the adjusted risk. Finally a second ratio is computed without the largest winning trade. (The exception is if the metrics go negative, the computation becomes a fraction of the average adjusted drawdown times adjusted net profit.) This is called PRR_NoBigWin. Code for the user function that computes the PRRR is also found on my website.
A SIMPLE TEST
The SFO_Test strategy trades a basket of 30 commodities both long and short on daily data. The concept allows entries if the current volatility is the lowest in 20 bars. If so, enter long at the highest high of five bars or go short at the lowest low of five bars on a stop.
Exit the long trade at market if a reversal-down bar occurred more recently than a reversal-up bar and if the current bar wick is bigger than the tail. A reversal down bar is one where the close is lower than the lowest low in the prior look-back bars (look-back is an input called Len1). The strategy is symmetrical for long and short trades. Slippage and commission was set to $30/round turn/contract. The lone input was optimized from 1 to 20 for each commodity. Code for the SFO_Test strategy is also found on my website.
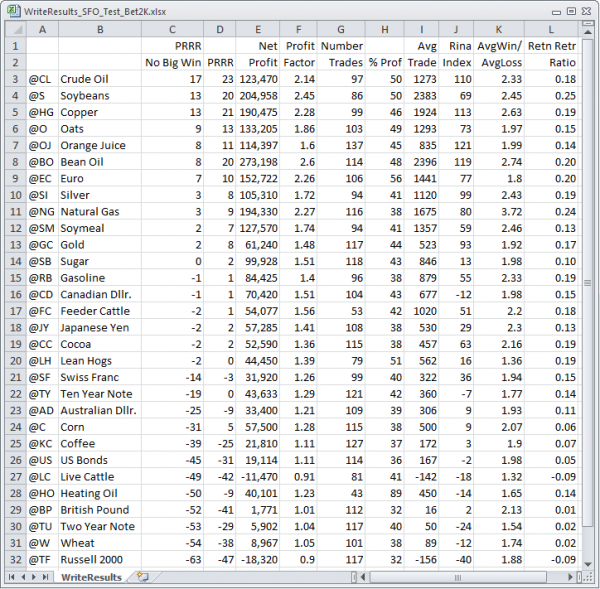
Figure 1 shows the results on the portfolio with other metrics from the TradeStation Strategy Performance Reports. Of all the TradeStation metrics, the RINA Index comes closest to identifying the best results. However, its failure to deal with the issue of one big winning trade is illustrated by picking orange juice as the best performer.
OJ went into a severe drawdown in December 2002 and did not emerge until August of 2007. The return retracement ratio actually accentuates reliance on one big trade. Natural gas would be ranked second, yet 60% of the total net profit came from just one trade. The average win/average loss does a poor job in ranking performance because it ignores drawdowns. None of the TradeStation statistics does a complete job of assessing the goodness of a trading strategy.
KEEPING TRACK
The reporting is done using the IES_WriteResults strategy that is called by the IncludeSystem statement from the SFO_Test strategy. Code for the IES_WriteResults strategy can also be downloaded from my website. This is a handy way to test across a portfolio. When you tweak a strategy variable and reverify, all windows are forced to update and the IES_WriteResults strategy appends the symbol, PRRR and PRRR_NoBigWin to a file called WriteResults.csv. This file can then be opened in Excel by double clicking on it. Don’t forget to create the C:XTRA folder as it is not automatically created.

