Instead of wandering around in circles until we lose our actual point we are going to cut to the chase. Hopefully. Our thesis is that the next major trend will involve or perhaps be based upon a resurgence in Japanese asset prices. Given that trends tend to begin when they make no sense and then build for years until they become blatantly obvious we take solace from the fact that there is little in the way of fundamental support for this view. Over time we may find that rising interest rates unlock Japanese consumer spending, the growth of consumer spending in China creates huge new markets for those products that Japan manufactures, or the initiation of conflict with China creates the impetus for Japan to rapidly increase defense spending. It may also have something to do with a prolonged period of relative flat energy and raw materials prices.
Below is a chart of the Nikkei 225 Index from the autumn of 2008 to the present day along with a comparison between the CRB Index (commodity prices) and former copper producer Phelps Dodge from the autumn of 1998 through the first quarter of 2004.
We are comparing the Nikkei today with the trend for the CRB Index and Phelps Dodge in the autumn of 2002. The argument is that each decade a new cyclical theme begins some time between the end of the ‘1’ year and the middle of the ‘3’ year.
We are using both the CRB Index and Phelps Dodge because they each turned higher at different points in time ten years ago. Commodity prices began to rise around the end of 2001 and then gained strength in 2002 on U.S. dollar weakness. Phelps Dodge, on the other hand, made its cycle bottom in the autumn of 2002 and then began to rise in earnest in mid-2003 once long-term bond prices started to weaken.
Our view is that the Nikkei’s trend turned bullish in the final quarter of 2011 but will not begin to truly rise until long-term Japanese and U.S. bond prices break clearly to the down side. This may help to explain our recent fixation on even small prices changes for the U.S. 30-year T-Bond futures.
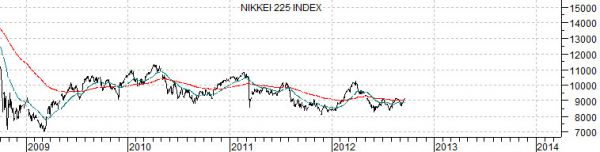
The key to a stronger Japanese market is, of course, a weaker bond market. The Nikkei 225 Index tends to outperform the S&P 500 Index when bond prices are trending lower.
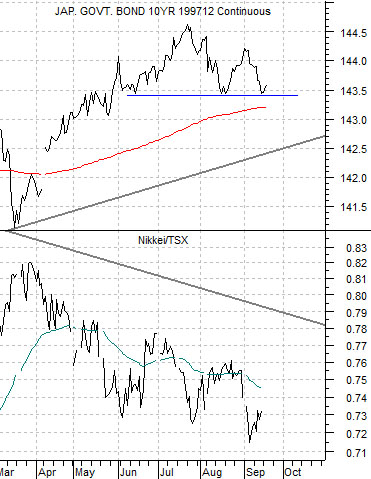
The chart at right compares the Japanese 10-year (JGB) bond futures with the ratio between Japanese and Canadian equities (Nikkei versus S&P/TSX Comp.).
The Nikkei/TSX ratio has been declining for more than two decades following the peak for the Nikkei in 1990. The chart makes the argument that a major trend change would require the JGBs moving first down through recent support and then below the rising trend/support line which cuts through around 142.50.
There have been rumblings in the markets that the Obama administration is set to release oil from the Strategic Petroleum Reserve (SPR) in a pre-election attempt to soften the negative impact of rising energy prices. We recall that President Clinton did something similar in the autumn of 2000 so… perhaps we shouldn’t be too surprised.
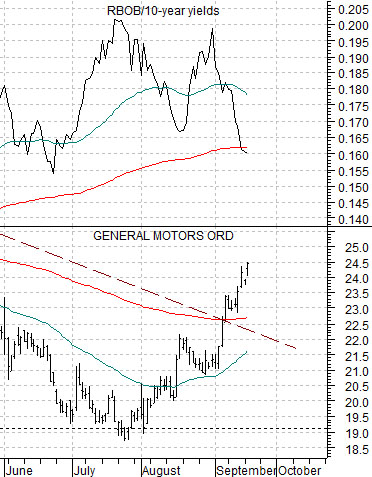
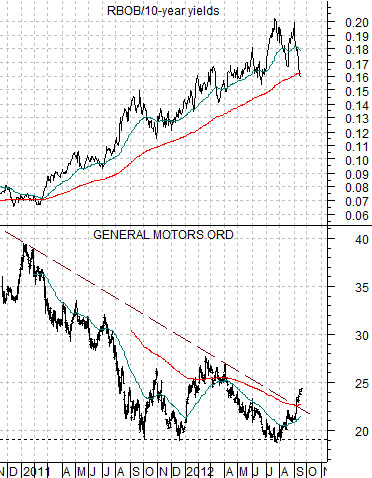
This is the time of year when gasoline prices tend to weaken relative to crude oil prices. Last year the gasoline/crude oil ratio declined in response to rising crude prices but this year it would take a much weaker U.S. dollar to keep the rising trend for crude intact. Our sense is that the rising trend for General Motors (GM) reflects the potential for a break lower in gasoline futures prices into the final quarter of this year. We show two chart comparisons of GM and the ratio between gasoline and 10-year Treasury yields below.