

You can be a far more astute technician than the supposed experts by understanding this simple fact: In an exchange market, price and volume are jointly determined through the agreement to trade. B = S = T is a simple formula to help you remember this fact, where B is the buyer’s volume, S is the seller’s volume, and T is the total trading volume.
In an exchange/auction market the number of shares Bought always equals the number of shares Sold, which always equals the Total number of shares traded. Trading volume then is the number of shares exchanged between buyers and sellers. Let’s put this knowledge into practice by logically applying it to the following quiz.
THE QUIZ
Let’s say that after analyzing the price-volume patterns in a particular stock you determined the stock to be a timely and attractive investment. To ensure that you do not miss out on any possible price appreciation, you enter a market order to buy 1,000 shares. Unbeknownst to you, a fundamentally driven fund manager somewhere has crunched some numbers and determined that the same stock has moved above its intrinsic value of $50 a share.
Feeling strong in her perception about the stock’s value, the fundamentalist enters an order to sell the firm’s 10,000 shares at a limit price of $50. On the exchange, these orders cross, thereby enabling you to buy 1,000 shares from the fund manager. So here is the question: Which force is in control, demand or supply? Is it you, the buyer, who has put in a market order suggesting your urgency? Or is it the seller with a limit order affirming her reluctance to sell below $50 but also with ten times as many shares to distribute?
If you are not certain about the answer, do not feel alone. The theoretical and practical answers have been debated. The essential point is that price is determined by the net of demand less supply. Thus, should the trade fill on an uptick, it indicates that there is more demand than supply, whereas should the trade fill on a downtick, supply outweighs demand. If you add up all these ticks and the price is heading down over time, they form a supply line; you have then what is called a falling support line.
In technical analysis, this is called a downtrend, indicating that over the course of time supply has overwhelmed demand. If after adding up all of the ticks over time and they are pointing upward, you then have a demand line indicating that demand has been greater than the supply over the course of time. In technical analysis, this line is referred to as an uptrend.
What if you had a way to look deep inside the interactions of these two opposing forces, supply and demand and thereby determine whether the volume supported the price action? This is the objective of volume analysis; to determine the strength of supply and demand by examining the asymmetric relationship between price and volume.
Bernardo and Judd (1996) described this relationship as follows, “Volume data is informational in this setting because prices alone do not fully reveal the magnitude of the private signals and their precision.” Thus, by analyzing price and volume together, one can determine whether the price-volume relationship confirms the price action, or contracts it, thereby giving notice of impending price movements.
RECENT MARKET ACTION
So what about the recently low volume? Yes, this year’s volume is lower than it was in 2008 and 2009. Keep in mind that the volume in 2008 and 2009’s volume was huge as the market was collapsing.
Volume is higher when new facts are entering the market. In 2008 and 2009, the market was factoring in the impact of a worldwide credit / liquidity crisis. Volume is also typically higher when markets are sharply down, as institutions are forced to severely discount shares to find buyers. This also often true when the markets are sharply up. But with this said, volume is not the only data set in volume analysis.
WATCHING THE FLOW
Volume analysis is more about “money flow” than actual volume. “Money flow” is not volume but rather the culmination of both price and volume. Volume is the number of shares exchanged. Volume speaks to participation. Price is the cost per unit, a testimonial of perceived value. To quantify money flow, we need both variables. Money flow then is price (cost per unit) * volume (the # of units exchanged).
HOW IT WORKS
It may help to think about it this way. When you buy a stock from your broker, they debit your account the cost paid for the stock multiplied by the number of shares purchased. When you sell a stock, they credit you the sales price of the stock multiplied by the number of shares sold. This is money flow in and out of your brokerage account as well as the market.
Seems simple, but the consensus of most market commentaries is to focus on these variables independently. Consequently, volume and price actions are widely misunderstood and thus misinterpreted. Take our earlier comments about low volume as an example; the recent volume is lower today than 2008-2009 but is the money flow?
One good way of measuring money flow is through cumulative capital weighted volume. Capital weighted volume is the true volume of an index. It is calculated by summing the volume of each individual index security member in proportion to its weighting within the index. Cumulative capital weighted then is thus a running total of the cumulative net of capital weighted up-volume versus capital weighted down-volume. Below is a recent chart of cumulative capital weighted volume.
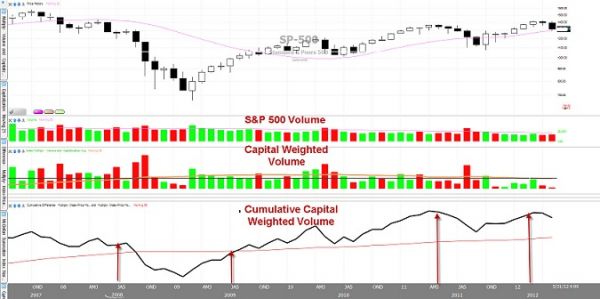
Note the above referenced chart. The cumulative net total of monthly capital weighted volume hit a new high last January of last year. So much for the widely circulated theory that “the money” was not flowing into the market. Because the market was lower in 2008 and 2009, less money left in 2008 and 2009 than what came in 2010 and 2011 when the market was higher (remember money flow = price * volume).
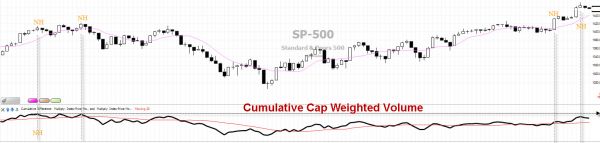
Also note how this years cumulative volume totals did not break its 2011’s highs despite the S&P 500 eclipsing its own 2011 highs in February and March of this year.
THE TAKEAWAY
This divergence was an excellent warning for the proceeding April / May decline and a good example of volume analysis at work.
Looking for more price-volume analysis examples? Watch how other traders apply volume analysis to enter a trade
[Editor’s note: Learn more in Dormeier’s book Investing With Volume Analysis. For a limited time this EBook is free on Amazon. See his profile below for a link.]

