
An interesting pattern has emerged in the ratio of Small Cap stocks vs. Large Cap stocks. The Small Cap/Large Cap ratio is comprised of the Dow Jones US Small Cap Index divided by the Dow Jones Large Cap Index. In March 2006, this ratio of Small Caps vs. Large Caps reached an intermediate term top, as noted below by the black arrow on the far left. Notice that the ratio peaked 18 months before the S&P500 peaked, in September 2007.
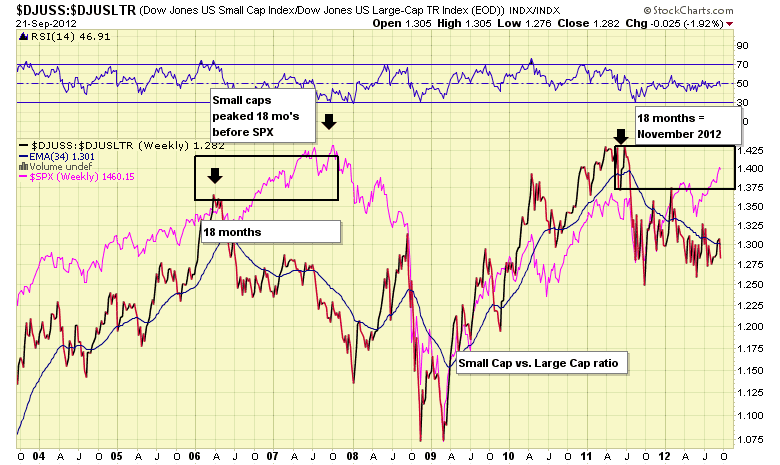
Now, fast forward to June 2011. The Small Cap/Large Cap ratio peaked at that time, as preference for more conservative, dividend-paying large caps exceeded interest in small caps. Today, the ratio sits near support denoted by bottoms in April 2012 and July 2011. The noteworthy observation in the above chart is that 18 months following the June 2011 peak, is November 2012.
Will November 2012 represent a possible intermediate-term top for the S&P500? The S&P500 remains in a clear uptrend, and faces potential resistance near the 1430 area last reached at the aforementioned peak in September 2007. This is an interesting technical coincidence and is worth watching.
At Baseline Analytics, we are trend-followers and rarely resort to picking targets on the indices. Our models however assess the risk to the current trend and its probability to change. Although there is growing bullishness as the “risk-on” trade prevails, investors are counseled to remain suspect and protective of their capital.

