We focused almost primarily on the month of October in last Friday’s issue. The idea was that cyclical bottoms are often made in the month of October in response to a seasonal trend that creates the impression of economic weakness into the autumn. On top of this the decade trend or theme tends to create bottoms into the final quarter of the ‘2’ year.
The problem is that ‘October’ is not quite the same thing as the first trading day of October. In 1987, for example, the entire ‘crash’- from break down to bottom- took place within the month of October so a bit of patience may still be required. Another example might be 2002 when the SPX ended September around 815 before declining to a closing low on October 9th at 776. and then finishing the month around 885.
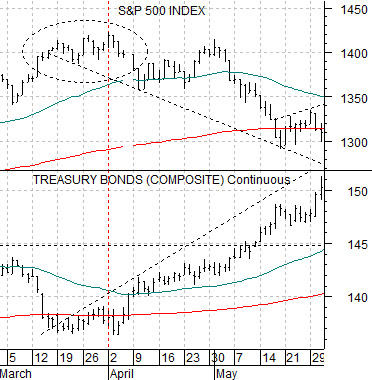
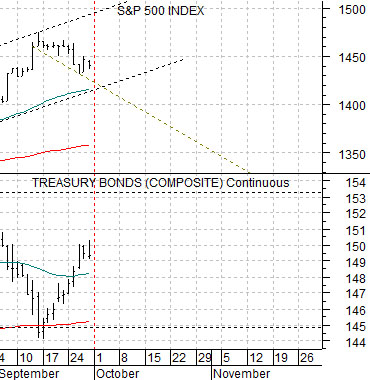
The recent rally in the long end of the U.S. Treasury market puts pressure on the short-term trend for equities. To explain we have included two comparative charts of the S&P 500 Index (SPX) and U.S. 30-year T-Bond futures. The chart at top right shows the time frame through the final month of this year’s first quarter through the first two months of the second quarter. The chart below begins in September and runs through the end of last week.
The TBonds made a bottom around the 200-day exponential moving average line in mid-March. From there the TBonds began to work higher which created bearish pressure on the SPX.
The SPX held near the highs through the earnings reporting period that extended through much of the month of April before swinging lower as an offset to the steady rise in bond prices. In this instance the trend was negative from March through May even as investors supported stock through the release of quarterly earnings.
In the current situation the bond market pivoted higher in mid-September off of the 200-day moving average line. While our expectation was that the TBonds might hold the moving average line, bounce, and then turn back to the down side the reality is that the longer the bond market remains stronger in price the greater the odds that the SPX will test back to its moving average line (currently around 1360).
The point is that the recent rising trend for bond prices is equity markets bearish.
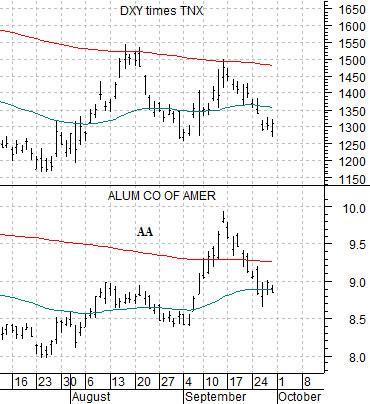
Below is a chart of Alcoa (AA) and the combination of the U.S. Dollar Index (DXY) times 10-year Treasury yields (TNX).
The DXY times TNX represents an intermarket outcome based on the trend for both the dollar and interest rates. The argument here is that the share price of Alcoa moves with this combination so a stronger dollar along with rising yields should help to support a rising trend for AA.
So… Alcoa leads off the quarterly earnings parade about 10 days from now with the markets expecting a year-over-year decline in earnings of about 94%. What we will be paying attention to this month is the way the dollar is trading along with the bond market. As an aside the inverse of the trend that would be favorable for Alcoa would be a weaker dollar and falling yields. This is, of course, the combination that is most positive for gold prices.
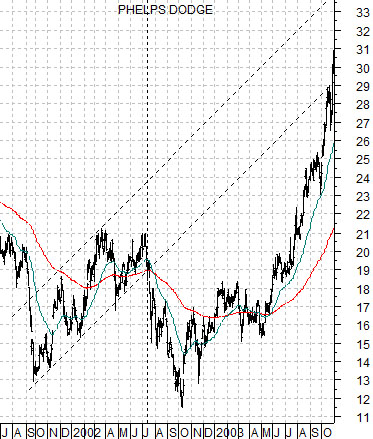
Below is a chart of copper producer Phelps Dodge from 2001- 03. This is the way the commodity theme that dominated the previous decade began ten years ago.
Notice that PD started to trend higher in late 2001 in response to stronger commodity prices and then broke to the down side into October of 2002 before pivoting back to the original rising trend.
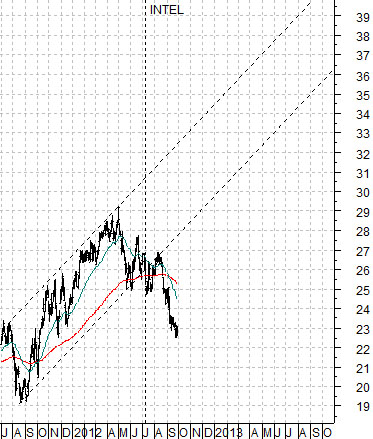
If we compare this with something like… Intel…. from the current time frame we get an amazingly similar picture. Intel started to trend higher during the final months of 2011 and then broke the rising channel in July of this year. If history were to repeat then we could very well see a cyclical bottom and pivot some time this month leading into a rather powerful bullish trend through the balance of 2013.
We should also note that much like Alcoa the share price of Intel tends to outperform when the U.S. Dollar Index is trending upwards.