

Many traders look at the election cycle in annual terms, trying to forecast what the next year will look like, but it is possible to generate a forecast for shorter-term trends as well.
THE HISTORICAL PATTERN
When traders look at the presidential election cycle, they often think in terms of years. The logic behind this cycle is that new presidents somehow seem to always discover that the economy, or deficit, or some important crisis, was much worse than they knew before the election. Because of the depth of the problem, they need to act quickly and decisively. The changes to the tax laws or spending shifts the new president is forced to take are usually unpopular with some and the actions almost always lower economic growth.
If all goes well, the worst of the impact is over within the first two years of the president’s term and the pain is forgotten before the next election. For the stock market, the result is a well-known cycle where the first two years of a president’s term see lower average returns than the last two.
IT’S A ROADMAP
This is an example of a well-known cycle and cycle theory is popular because it gives traders what looks like a roadmap to the future. When the cycle is tied to a logical story, the trader can be even more confident in the roadmap. Cycles can be useful but they should only be one factor that traders use in making their buy and sell decisions.
The election cycle forecasts the general trend of the next year and because the course of election events is known in advance and unchanging, this cycle has a very logical basis. But the six months around an election also follow a schedule. Elections always occur on the first Tuesday after the first Monday in November and inauguration always follows on January 20.
MEDIA BLITZ
Media attention focuses on the first 100 days of a president’s term and there is generally a great deal of activity related to executive orders and legislation during that time. That makes the political season from November of an election year through April the next year fairly predictable and it makes sense that the markets should follow a pattern that reflects this activity.
LOOKING AT AN ETF
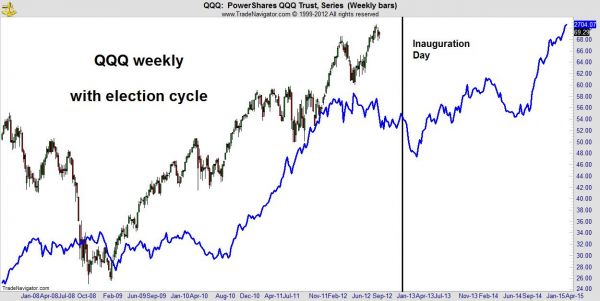
This cycle forecasts a bearish six months for PowerShares QQQ ETF (NASDAQ: QQQ).
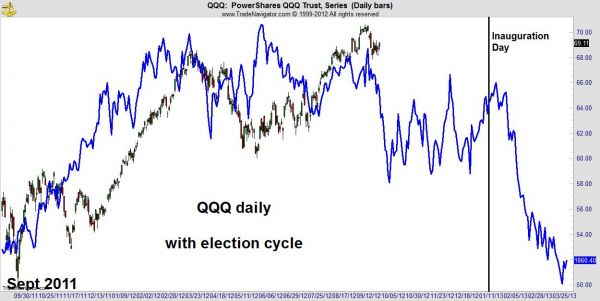
A decline into the election would be expected according to this cycle and a steep drop in QQQ could follow early next year. Traders in QQQ should be nervous and possibly even short through the first three months of 2013. QQQ has declined in the first quarter of a president’s term every year since it started trading.
Longer-term, after the bottom expected in early April 2013 is completed, we could enjoy a large up move.
BULL RUN LOOKING VULNERABLE
In the past, the market has not precisely followed the presidential election cycle or any other cycle. However this indicator is offering a warning at a time when the stock market’s three and a half year bull run is extended and looking vulnerable.
TRADING IT
To use this indicator in a strategy, it should be one of several inputs. It is always dangerous to attempt to pick tops or bottoms in any market and for now, stock prices are still moving up. Shorting in the hope of catching the top is a high-risk trade that has led to the destruction of a great deal of wealth. Top picking is especially dangerous now as the Federal Reserve is intent on pumping up the economy and traders have always been cautioned to “never fight the Fed.”
JANUARY SHORTS
Tighter stops could be warranted given where we are in this cycle and if a sell-off develops, especially in early January it could be worth shorting aggressively. Traders should also consider looking at adding some short positions to their portfolio, maybe in the form of low-cost put options that could deliver large rewards if there is a decline.
This election year could very well turn negative in the stock market just as it seems to be turning negative in the campaign ads. But, until the trend turns down, traders should maintain at least some long exposure to stocks. There is always plenty of time to take advantage of trends after they have begun.
= = =

