Let’s get the jobless claims topic out of the way first. From CNBC.com yesterday, ‘Stocks erased their earlier gains to hover around the flatline Thursday as the earlier bounce from a better-than-expected jobless claims report fizzled… On the economic front, weekly jobless claims tumbled 30,000 to a seasonally adjusted 339,000, hitting the lowest level since February 2008, according to the Labor Department… However, the report may have been distorted by one state not posting its claims number for the week as expected. A Labor Department spokesman said the state accounted for much of the decline, but did not name the state.’
The point? A bit less clear than we had hoped. We finally get a number sub-350,000 in the seasonally weak month of October setting up the ideal conditions for a cyclical pivot and… the numbers are suspect. Sigh.
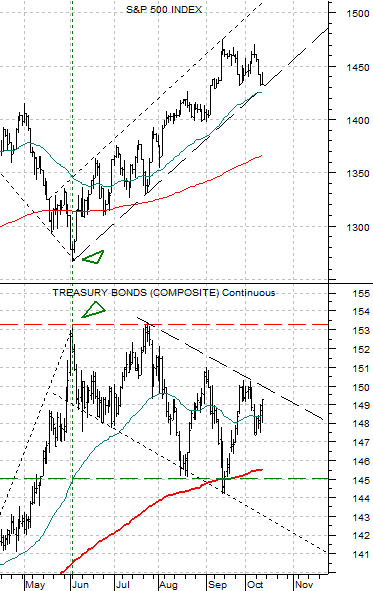
At right is one of the simplest intermarket views that we will show. We are comparing stocks versus bonds. Risk on versus risk off. Or something like that.
The S&P 500 Index began to rise up a nicely defined trading channel at the exact point in time that the price of the U.S. 30-year T-Bond futures reached a peak at the end of May. We are now into the fifth month of the same old, same old.
The argument has been that as long as the TBond futures remain below the peak levels set in May and July (around 153) but above the 200-day exponential moving average line (red line on chart) the SPX should hold within the trading channel. This means a continuation of higher lows and higher highs.
An alternate view is based on the downward sloping channel added to the chart of the TBond futures. It appears that the markets may decide to test SPX between 1420 and 1430 on any upward push by the TBond futures through 150. Given that the top edge of the declining resistance line for the TBonds has not been broken there is no way for us to know how this may play out. To be safe… we remain bullish on equities as long as the TBond futures remain sub-150. From 150 up to 153 things become nervous and over 153’ish puts the entire rally at risk.
There is a reasonable chance that we are going to fixate on the smallest of details even as the markets complete a broad cyclical pivot. A cyclical pivot includes rising interest rates and renewed strength in many of the lagging sectors that depend on positive economic growth.
We are firm believers in the seasonal trend. This trend creates the impression of weaker growth into the autumn and strong growth into the spring. When the markets are worried that growth is too weak this tends to create cyclical asset price bottoms in October or November. At other times the markets are worried that growth is too strong creating upward pressure on inflation so a slower pace can at times be viewed as bullish. The current time frame is definitely more the former than the latter.
We also believe in the decade theme. The thesis is that the markets do similar things each decade around the same time. Major cyclical bottoms tend to be put in during the second half of the ‘2’ years.
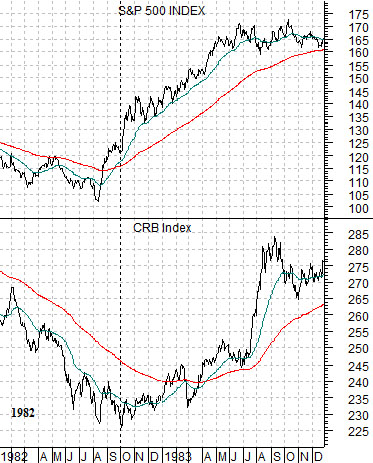
At top right is a chart from 1982 of the S&P 500 Index and the CRB Index. Equity prices bottomed in August of 1982 while commodity prices followed a couple of months later after reaching a low in October.
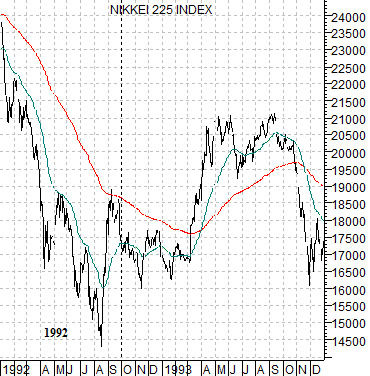
Below right is a view of Japan’s Nikkei 225 Index. While the hottest sector through the 1970’s was based on commodity prices (hence the focus on the CRB Index in 1982) the market that rose to a ‘bubble’ peak into 1990 was Japan. The Nikkei made a fairly significant bottom in August of 1992.
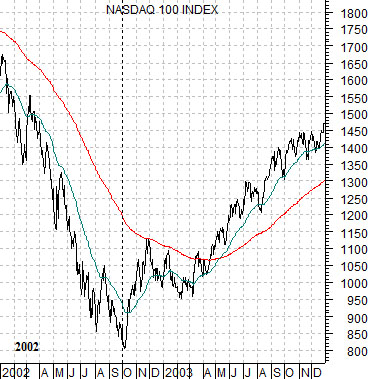
Below is a chart of the Nasdaq 100 Index. After commodity prices peaked in 1980, Japan in 1990, the next ‘bubble’ was found in the internet/tech/telecom sectors. 2000 saw the cycle top for the kind of large cap tech names that make up the Nasdaq 100.
The point? The bear market bottom for the Nasdaq was made in October of 2002. Three post-bubble markets and three bottoms between August and October of the ‘2’ years.