In a markets trend that works from ‘offsets’ the idea of bull market or bear market loses both importance and relevance. Now we have to find some way to explain what this is supposed to mean.
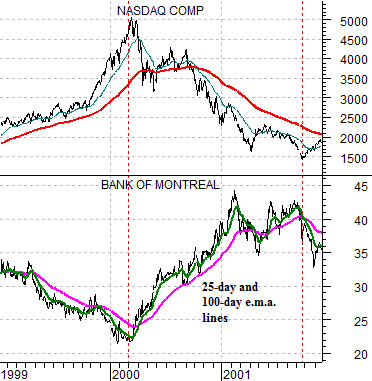
Below is a chart comparison from 1999- 2001 of the Nasdaq Composite Index and the share price of Canada’s Bank of Montreal (BMO).
By simply looking at this chart answer the following question: when was the trend bullish and when was it bearish?
The answer, of course, depends on one’s perspective. 1999 was bullish in terms of the Nasdaq but bearish for a number of interest rate sensitive sectors. The money that flowed towards the Nasdaq came from destinations such as the BMO. The trend was clearly bullish for ‘tech’ and just as clearly bearish for the Canadian banks.
It is widely accepted that the stock market peaked in 2000 and bottomed in 2002. The bull market top was reached through the second and third quarters of 2000 while the bear market bottom was made in the autumn of 2002. Yet… the Nasdaq’s bear market in 2000 created the bull market for Bank of Montreal. In a market that works from offsets (i.e. strength in one sector going with or creating weakness in another) the idea of bull or bear market loses meaning as an absolute concept because the direction of the trend depends almost entirely on your perspective.
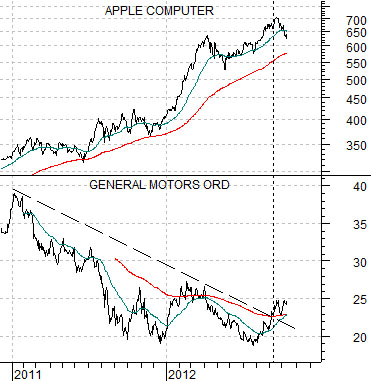
We took a rather tortured route to get to our point today. In last Friday’s issue we showed in the back pages charts of General Motors, Apple, and the ratio between gasoline futures (RBOB) and 10-year yields.
The point that we have been pondering of late has to do with the similarity between the trends for Apple (AAPL) and gasoline/yields. Both have been rising. We will not argue that Apple has anything to do with interest rates much less gasoline prices but it may be that both are creatures of the same trend as price strength feeds from price weakness in other sectors in much the same way that the Nasdaq’s momentum through 1999 came from money moving away from Bank of Montreal.
We wonder whether the upturn in the share price of GM over the past few months is in some way, shape, or form an indication that money is finally starting to shift away from the ‘strong energy price’ trend as well as investors torrid love affair with a number of high-flying consumer growth stocks such as Apple, Chipotle Mexican Grill, and Lululemon.
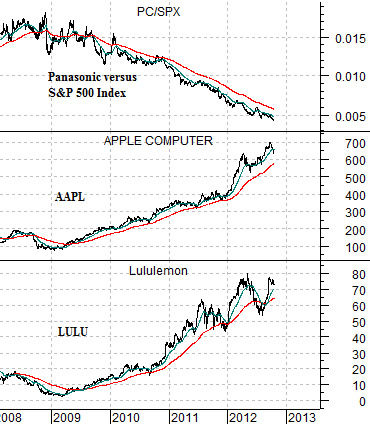
Quickly… below is a chart of the ratio between Panasonic (PC) and the S&P 500 Index (SPX) along with Apple (AAPL) and Lululemon (LULU).
The argument is that we are looking at ‘offsets’. Weakness in the laggard cyclicals (in this example PC or the PC/SPX ratio) is pushing money towards growth stories like AAPL and LULU. The real test will come if, as, or when the PC/SPX ratio starts to rise.
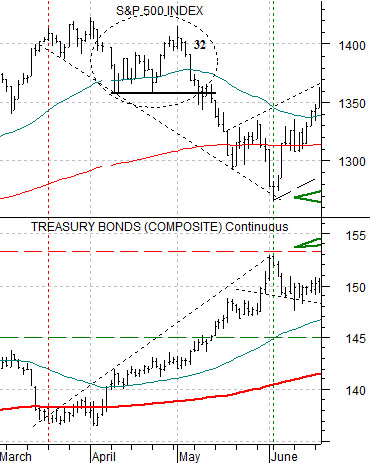
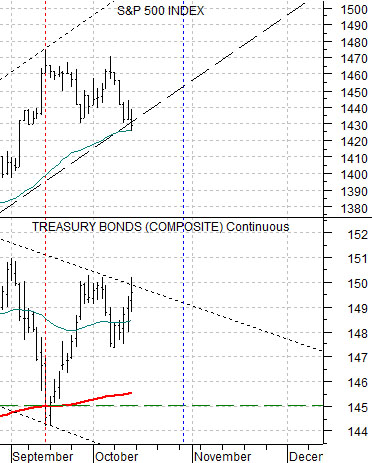
Below are two charts of the SPX and the U.S. 30-year T-Bond futures. The top chart is from March into June of this year while the lower chart starts towards the end of August.
For as much as we like to write about ‘crash tops’ we actually missed this one. A crash top tends to build over 32- 34 trading days from the point where negative pressure begins. In this instance the bond market turned higher in March while the SPX held near the highs for 32 trading days into early May. The ensuing decline wasn’t exactly a ‘crash’ but the structure of the correction and the way it built was in some ways similar.
The point? Bond prices have been rising since mid-September. This means that as long as the bond market is resolving higher there is downward pressure on the stock market. If the TBonds were to move upwards through the balance of this month while the SPX floats back towards the recent highs then a ‘count’ of 32 days would put the next decision point some time around the end of this month.
The argument is that IF bond prices move higher from current levels then the offset- falling stock prices- may show up in something of a concentrated manner around the end of this month. For what it is worth of course.