It is once again time for the U.S. weekly jobless claims report. We have argued for the past few years that this is likely the most important economic number for the markets. Inflation numbers come and go, trade deficits rise and fall, budget deficits simply rise, and week after week the markets seem to be keying in on U.S. jobless claims.
The idea is that claims below 350,000 should be sufficient to start lowering the U.S. unemployment rate which leads to more income and, of course, more spending. In a world seemingly bereft of positive economic drivers the health of the U.S. consumer may be critical. Our thought has been that a solid decline below 350,000 may be enough to create what we call the ‘cyclical pivot’.
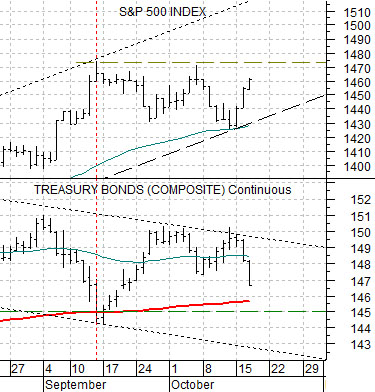
Below is a chart of the S&P 500 Index (SPX) and the U.S. 30-year Treasury bond futures. This is a shorter-term view of the chart that we used in yesterday’s issue.
The ‘cyclical pivot’ describes the point in time when the markets shift over from interest rate sensitive and defensive sectors back to the more economically leveraged cyclicals. It is the kind of trend that is good for ravaged markets like Japan and bad for safe haven destinations such as the bond market.
The first thing that has to happen is… the TBond futures have to break below the 200-day exponential moving average line. This was accomplished- briefly- in September following the last Federal Open Market Committee followed by another bounce for bond prices as the SPX flattened out below 1470- 75.
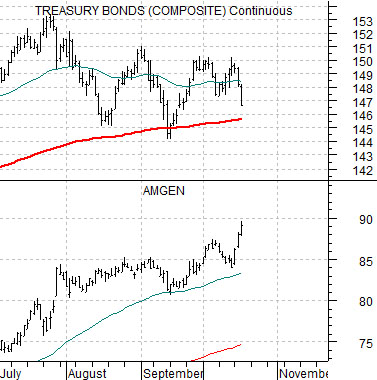
Below is a chart of Amgen (AMGN) and the TBond futures.
One notable detail from the last cyclical pivot way back in 2003 was the way Amgen’s share price pushed higher right up until the point in time when the TBond futures fell below the moving average line. This has been an ongoing argument of ours over the months.
Interestingly… we haven’t been wrong as of yet. AMGN closed at a recovery high yesterday as the equity markets responded positively to a weaker bond market. While the TBonds haven’t fallen through the moving average line the last two days of trading have certainly made this a more timely issue. And today… we get the jobless claims report.
Let’s get the caveat out of the way first. Over the decades we were fascinated by the seasonal action for Alcan. When the stock sold off into October it was invariably a ‘good buy’ while declines into March also preceded strong recoveries. In 2007 Rio Tinto took over Alcan and we stopped paying attention.
One might think that Alcoa and Alcan- two aluminum producers- would trade in some sort of sync but that was actually not the case. Yet when Alcan disappeared we started to focus on Alcoa.
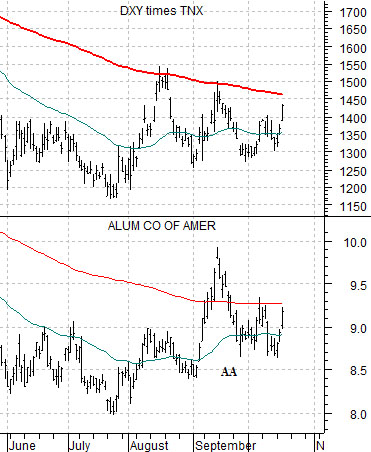
In any event… at top right is a chart of Alcoa (AA) and the combination of the U.S. Dollar Index times 10-year Treasury yields. The argument is that AA does better with a stronger dollar and is particularly strong when the dollar AND yields are rising together. One of our thoughts from a past issue was that the DXY times TNX has to break above the 200-day e.m.a. line in order to indicate that the intermarket trend for Alcoa is turning bullish.
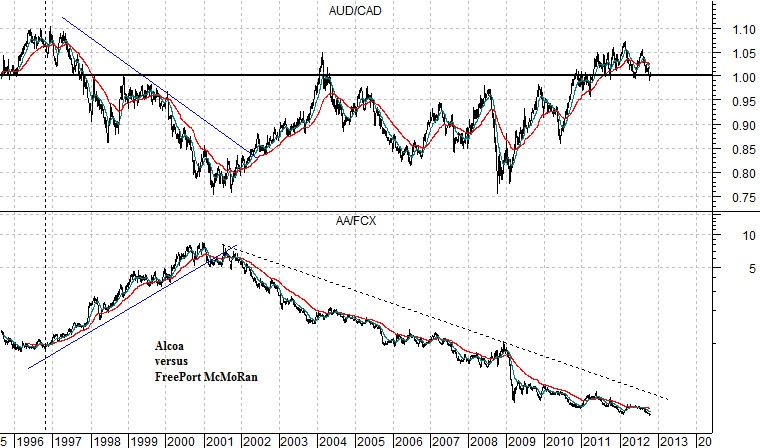
We have fixated from time to time on the cross rate between the Australian and Canadian dollar futures (AUD/CAD). The idea is that the AUD trends more with Asian growth while the CAD is somewhat more sensitive to North American growth.
The chart below compares the AUD/CAD and the ratio between Alcao and copper producer FreePort McMoRan (AA/FCX). Is it somewhat obvious why we are fussing over the AUD/CAD? One has to go way back to around the end of 1996 to find a time frame that included weakness in the AUD/CAD and an significant upswing in the relative price action for Alcoa versus the base metals miners.