

This technique is likely the most important strategy development tool that you will ever use.
There is no better way for you to test your ideas and generate some level of confidence in them prior to actually trading them. Too often, I see traders cobble together an RSI technique with a Keltner channel or moving average cross-over technique and possibly an ADX filter without ever having any clue if an individual technique, apart from the others, has any predictiveness.
DOES IT WORK?
Predictiveness is the extent to which a technique can be relied upon to be profitable. Having predictiveness means that the technique has a high probability of generating consistent positive returns in any kind of market. That includes trending, trendless, volatile, non-volatile, and cyclical market conditions. The tool uses semi-random entries with random exits and measures performance by counting the percentage of profitable iterations in the optimizer. The random exit technique assures that each iteration of the optimizer will generate an entirely different set of trades from each of the other iterations.
TEST EACH ONE SEPARATELY
If you choose to use an RSI, a moving average cross-over and an ADX technique for your strategy, then you need to test each technique separately to see if they have any merit. It makes no sense adding a filtering technique such as ADX to a strategy if all by itself it has no predictiveness.
AN EXAMPLE
Let’s take a specific example. Larry Williams has postulated that markets tend to bottom when price closes near the lows of the true range of the bar. He calls this the Price Cycle. More specifically he has an indicator that computes the average of the close minus the low divided by the average of the true range. The formula looks like this:
PriceCycle = 100*Average(C-L, Lookback)/Average(Truerange, Lookback)
This is an oscillator that varies from 0 to 100.
HOW IT WORKS
The strategy looks for a buy entry signal if the PriceCycle crosses above 40. The exit occurs a random number of bars later. The testing is done by optimizing a variable called “Dummy” from 1 to 200 which does nothing more than run the strategy 200 times. If we did this without adding some randomization in the mix, we would essentially get the same set of entries and similar exits and the results would not be very robust because one big winner could bias the result.
So a rule is added that even though a buy signal is qualified, it must meet the coin flip rule. The coin flip is a bit of code that generates a 50% chance of taking the trade. So when the optimizer runs the “Dummy” from 1 to 200, there will be 200 different results in the Optimizer Report. No iteration will be identical to any of the other 200. This simulates the idea that perhaps, you cannot rely on every one of the entries all the time meaning that all the other entries need to measure up as well.
TESTING EXITS
For the exits we want a controlled test to allow us to see how robust the idea is if we hold the trades between 1 to 4 bars, 5 to 9 bars, 10 to 14 bars, 15 to 19 bars and 20 to 24 bars. By breaking the testing down into time windows like this we can see if the idea has any validity and over what time period it is valid. This means we will know over what holding period the idea has predictiveness. To get the results in this form there are 2 inputs. The “WaitBars” input is the first number of bars to hold the trade.
Then a random number is computed from 0 to the “TestInterval” input value. So if “WaitBars” was set to 5 the trade would be exited a random number bars between 5 and 9 after entry. The “TestInterval” is an input but for this example, it was set to 5 and not changed. The whole purpose to the randomization of exits is to simulate the results of a holding period that is somewhat data independent. The code for this strategy is shown at the end of this article.
CHANGE THE INPUTS
The testing is done by changing the “Lookback” and “Waitbars” inputs to the settings you wish to test. Then run the optimizer on the “Dummy” input from 1 to 200. Count the number of profitable tests in the Optimizer Report and convert it to a percentage. Ideally you want to see 100% of all the tests are profitable and often that is achievable. It means the algorithm has predictiveness in the time window that you tested. Any result that comes in at 50% indicates the algorithm has no predictiveness in that time window. Obviously it becomes more strongly predictive if the result is 100% in more than 1 time window but that is not common.
THE WINNERS
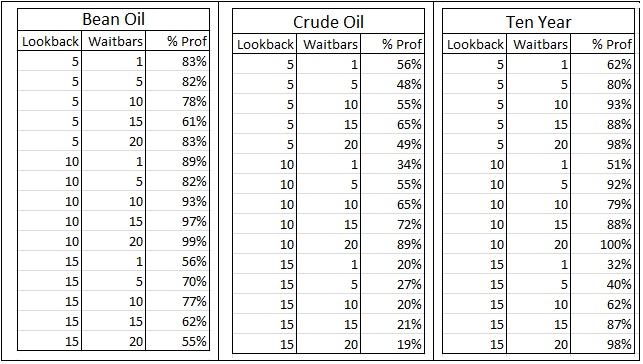
Testing was done on roughly 11 years of daily data for Bean Oil, Crude Oil and the Ten Year Note. The results can be seen in the screen shots below. Bean Oil did reasonably well for “Lookback” values of 5 and 10 bars. There was clearly some predictiveness for all the “Waitbar” values tested on those “Lookback” lengths. Crude Oil showed some promise at only one setting where the “Lookback” was 10 and the “Waitbars” was 20. This was not encouraging and you have to believe that the algorithm has very limited predictiveness on Crude. The Ten Year Note showed predictiveness when the “Lookback” was 5, 10 or 15 and the Waitbars was not 1.
BOTTOM LINE?
This algorithm can be used for Bean Oil and the Ten Year note but not Crude Oil. What this testing does not tell you is the magnitude of the risk involved in holding the trade. Some trades may have gone into a deep drawdown and reversed, finally closing profitably and you can’t measure that with this tool. However, as a first step in the development process, you should vet your algorithms to be sure they have some predictiveness before combining them with any others. There is no sense trying to dress up a loser with more filters. At least in this way you will give your ideas a fighting chance and minimize the probability of curve-fitting.
TradeStation Easylanguage Code to the SFO_RandomExit Strategy
Inputs: Lookback(20), OSLevel(40);
inputs: Waitbars(5), Testinterval(5), Dummy(200);
vars: OscVal(0), Randnum(0), TakeTrade(false), mpos(0), Buysig(false);
Oscval = 100*Average(C – L, Lookback)/average(truerange, Lookback);
Buysig = Oscval crosses over OSLevel; // entry condition
mpos = marketposition;
//hold trade for a random number of bars in Test Window
if barssinceentry = 0 then
Randnum = waitbars+round(random(Testinterval),0);
TakeTrade = Mod(round(Random(9),0),2) = 0; // coin toss here to take entry
if Buysig and TakeTrade and mpos < 1 then Buy next bar market;
if mpos = 1 and barssinceentry = Randnum-1 then sell(“randlx”) next bar market;
#####

