Our basic view has been that as long as the long end of the Treasury market remains flat in terms of price the S&P 500 Index should grind to the upside. From time to time the trend gets somewhat choppy but as best as we can tell… nothing much has changed.
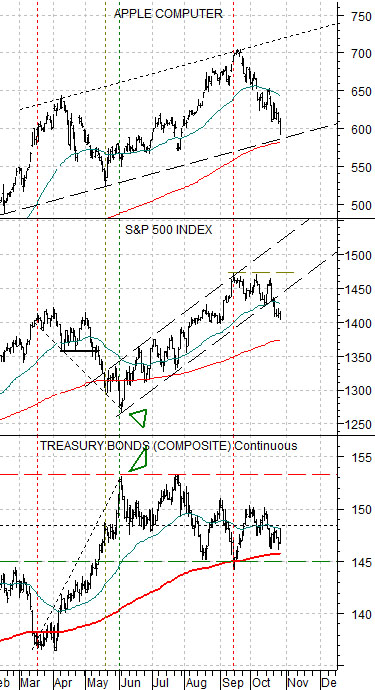
Below is a chart comparison between Apple (AAPL), the S&P 500 Index (SPX), and the U.S. 30-year T-Bond futures.
We have added a trading channel on to the chart of Apple. This is, as one might expect, somewhat arbitrary even though the ‘fit’ looks fairly reasonable.
The last time Apple’s share price declined to the channel bottom was May of this year. From there the stock bounced back up to the 50-day e.m.a. line before flattening out.
Once AAPL settled back at the moving average line the S&P 500 Index made one last spike lower into the end of May.
The final bottom for the S&P 500 Index went with the last peak for the TBond futures. In other words the low point for stocks went with the high point for bond prices.
The situation today is similar to last spring in that the share price of Apple is trending lower and is now below the 50-day exponential moving average line.
The major difference can be seen through the action in the bond market. There simply isn’t the same kind of flight by capital away from risk (equities) and towards safety (bond) as there was during the second quarter of this year.
In any event… the chart detail that we are paying attention to relates to the share price of Apple. If the sell off back from 700 to below 600 is broadly similar to the action during April and May then we should also be approaching some sort of bond price to and stock price bottom.
Strangely enough… it is quite rare for the S&P 500 Index to sell off through the month of October. The SPX often weakens into October but it usually powers higher through the release of quarterly earnings.
In 2008 the SPX weakened through October but we suspect that this was a bit of a statistical outlier. In 1987 the stock market crashed in October and in 1990 the bear market ended in October but both examples were somewhat extreme.
Where are we going with this? We argue from time to time that markets that push higher through the release of quarterly earnings are more likely to turn lower late in the month once ‘the news’ has passed. On the other hand when the SPX is pressured lower in response to quarterly earnings it is more likely to pivot back to the upside.
Some time late in the first month of a new quarter the focus shifts from what happened last quarter to what is happening in the current quarter and this has the potential to change the trend for prices.
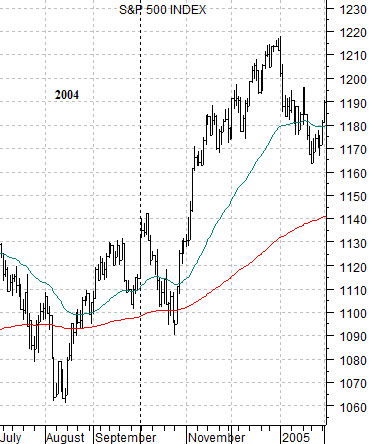
Below is a chart of the SPX from 2004. Notice that the index moved lower through much of October and then pivoted back to the upside.
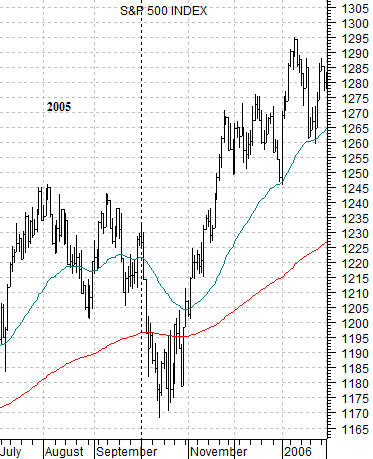
Below is an example from 2005. Once again we can see the SPX selling off for much of the month of October and then shifting back into a powerful rally.
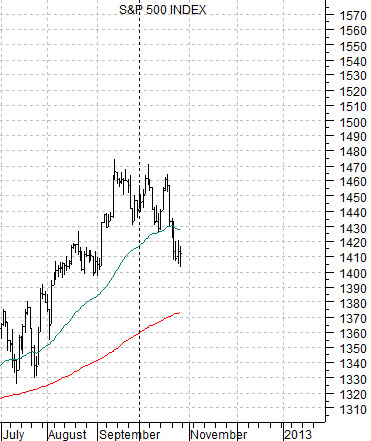
Below is the current case. Our thought is that nothing much has changed in terms of either the dollar or the bond market so the trend for the SPX should still be higher. If that is correct then what we have seen this month appears to be little more than a bit of backing and filling.