For the last few weeks we’ve been looking at the Euro. The 200-day moving average has held support to the downside and a weekly trendline to the north has held upward resistance. There’s only so much to be said about this range trade, and we can sum most of it up in the old saying buy low and sell high. That’s generally a good play as long as highs and lows hold.
LIGHT VOLUME ACTION TODAY
Now, let’s look at a few fundamentals. First, it’s safe to say we should expect light volume throughout Monday. New York is battening down the hatches for Sandy and floor trading will be closed on the exchange. So I wouldn’t expect a lot to happen in terms of significant levels being broken.
JOBS DATA THIS FRIDAY
On the longer term, we start the week off with the last week in October and end the week with the first few days of November. All eyes will end up on the U.S unemployment rate this Friday. In other words, we will likely start off slow and end with a bang.
BLACK CATS AND GOBLINS
In addition, this is the last full week before the presidential election. Watch out not only for black cats, ghosts, goblins, and neighborhood trick-or-treaters but also October surprises, market uncertainty, and hypersensitivity to news. Keep your eyes open for those annoying subtexts in economic data. Remember, two months ago the unemployment rate dropped because more than the expected number of people dropped out of the workforce and last month it dropped because more people than expected um… actually I’m not sure why it dropped.
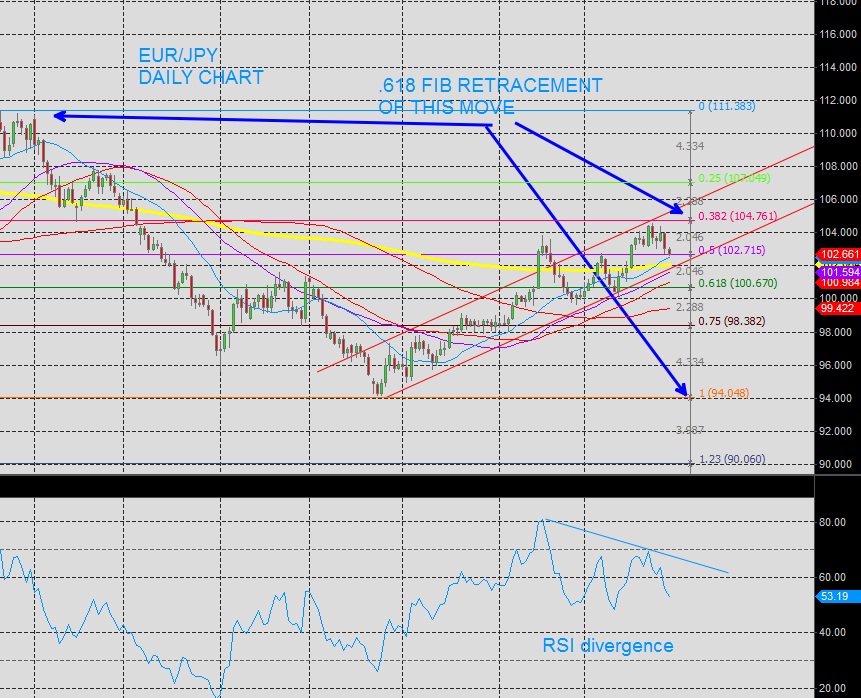
LOOK AT THE CHARTS
So, when fundamentals are giving us mixed messages, we should probably do what most successful traders do and look at the charts.
The Dow, S&P and gold have all broken below ascending daily trendlines. The AUD/JPY is once again near significant daily highs around 83.472. The euro is still range bound, so lets ignore that for now (or just trade off levels we’ve been talking about). This means, the EUR/JPY short may provide a few pips. The daily channel recently topped at the .618 retracement of the move from March through the end of July. We have some RSI divergence and we are coming up on a daily trendline.
KEY TRENDLINE TO WATCH
If we break this trendline, look out below. In the near term, the scalper or day trader may look to buy near the 200 day moving average, fib support of the most recent minor swing move higher, or a test of that trendline. Remember what we talked about with the DOW, S$P and AUD/JPY. While the EUR/JPY is still in a daily uptrend and there will likely be buying opportunities, I’m not sure new highs are in the cards just yet.
= = =
Read more trading ideas here.