

Will Santa Claus come to Wall Street this year?
With the fiscal cliff looming and the fear of higher capital gains taxes, today’s popular wisdom would have us believe that there’s good reason to worry that Saint Nick may not put in an appearance. If he shows up at all, he’ll probably bring switches to the market and stuff traders’ Christmas stockings with nasty lumps of coal.
But that may not be the case.
Historically, a year-end Santa Claus rally has been an amazingly consistent phenomenon, with stock prices typically moving higher during the last five or six trading days of the year and the first couple of trading days of the New Year as well. When we look back at past market performance, we can see that during the last 25 years there have only been six times when that year-end time period failed to produce higher prices in the S&P 500.
On those relatively rare occasions when the Santa Claus rally doesn’t materialize, it’s typically an indication that a bear market will unfold during the year to come.
For most traders a Santa Claus rally may be little more than a curious bit of traditional market lore. But for the astro-trader it’s an opportunity to understand one of the predictable ways that planetary movements correlate with high-probability market trends, demonstrating the power of astrology as a tool for effective trading.
The time for the Santa Claus rally begins each year a few days after the Winter Solstice on December 21, when the Sun moves into the zodiac sign of Capricorn. This date was recognized by W. D. Gann as one of the power points of the year, a key astrological turning point that can signal important shifts in market trends. My own back-testing of the Sun’s ingress into Capricorn has shown that it is mildly bullish for the S&P 500, with that index moving higher on the trading day following the event over 52% of the time.
In order to understand the real astrological significance of the Santa Claus rally, however, we need to consider the Sun’s annual motion at the close of the year relative to the horoscope for the New York Stock Exchange, which had its inception on May 17, 1792. This chart is shown in Figure 1.
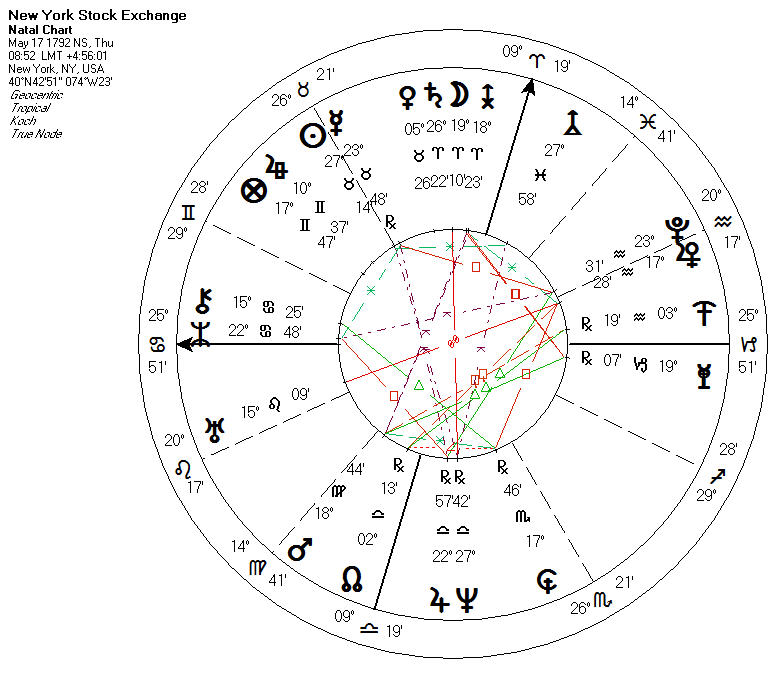
During the final trading days of the year and the first trading days of the year that follows, the Sun moves from 3 degrees Capricorn to 13 degrees Capricorn. As it does so each year, it forms powerful alignments with key planets and planetary midpoints in the New York Stock Exchange horoscope.
It begins by forming a trine, a harmonious 120-degree angle, to the NYSE Venus. Venus is one of the “money planets” in traditional astrology, so this solar alignment helps set the stage for some positive price action.
The Sun then moves into a 90-degree alignment with the Mars/Jupiter midpoint in the horoscope for the New York Stock Exchange. The combination of Mars and Jupiter is indicative of successful action, so when the Sun triggers these planetary midpoint traders typically experience a burst of confidence.
A couple of days later the Sun continues in its passage through Capricorn to form a 135-degree angle to the midpoint of Venus and the transneptunian factor Apollon. The Venus/Apollon combination suggests widespread harmony and positive feelings, so if a rally has gotten underway by that time we can usually expect it to expand when the Sun makes that alignment.
Just after it triggers the Venus/Apollon midpoint, the Sun forms a 45-degree angle to the NYSE Pluto, the planet associated with big money and large trading transactions, and a 135-degree angle to the NYSE Mercury, the planet most strongly associated with day-to-day trading activity and short-term price swings.
Finally, as it nears the end of the Santa Claus rally period, the Sun moves into position to form a 135-degree angle to the Sun in the original NYSE horoscope. This Sun/Sun alignment can promote an extra surge of energy and enthusiasm, which sometimes adds a grand finale to the visit from Santa Claus.
Unless you’re an experienced astro-trader or an avid student of market geometry, these angular planetary relationships may seem totally confusing, or at least extremely abstract. That’s why it’s helpful to see them in action, as illustrated here with the chart for the S&P 500 in Figure 2.
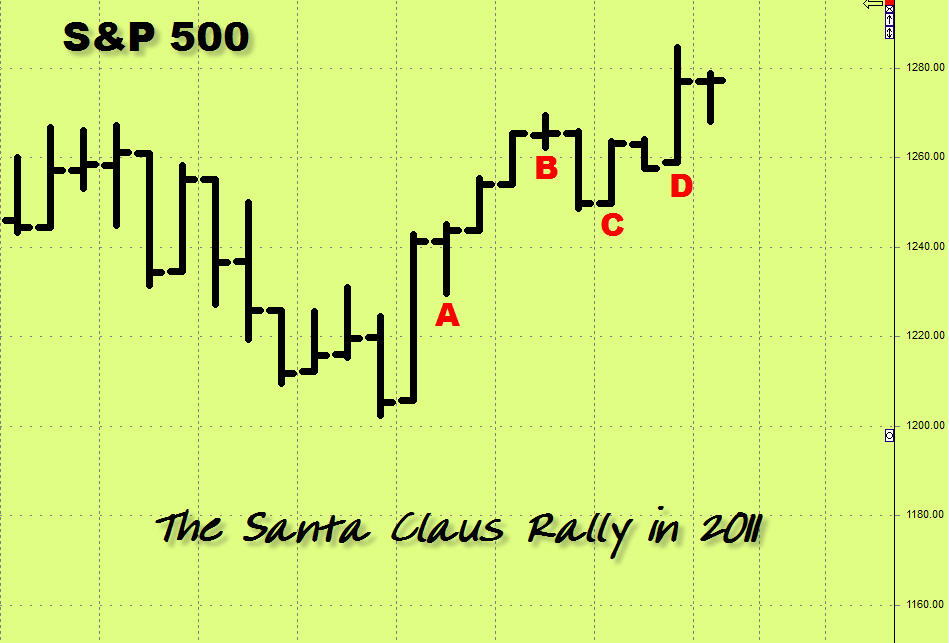
The daily price bars on this trading chart show the action in the S&P during the closing days of 2011 and the first few days of 2012. The price bar at point “A” is December 21, 2011. The exact moment of the Winter Solstice came about half an hour after midnight on December 22. On December 21 the S&P closed at 1243.72.
The Santa Claus rally was already picking up steam by December 27, at point “B” on the chart. That’s when the Sun triggered the NYSE Venus and the NYSE Mars/Jupiter midpoint, and the S&P closed at 1265.43.
There was a brief price pull-back until the Sun’s next planetary trigger on December 29 (point “C”), when it activated the NYSE Venus/Apollon midpoint. The S&P regained much of its lost territory that day, closing at 1263.02.
The grand finale effect was in full swing on January 3, 2012 (point “D”), when the Sun made its 135-degree alignment with the Sun in the NYSE horoscope. The S&P 500 finished that trading day at 1277.06.
On January 4, the last day of the Santa Claus rally period, the S&P closed at 1277.30. This was a gain of 2.7% from its price level on December 21.
The important point to remember here is that the Sun makes these same alignments with the NYSE horoscope each year, which is what creates the environment for the Santa Claus rally. The exact nature of the rally will vary from year to year, however, because the Sun isn’t the only astrological factor impacting the chart for the New York Stock Exchange. Depending on the action of the other planets, the rally can be stronger or weaker– or some years there may not be a rally at all.
Although there are some inhibiting factors at work this year, it does look like there’s enough planetary strength to support a rally as we close out 2012. At least that’s the outlook if you enjoy the astro-trading advantage– or if you still believe in Santa Claus!
= = =
Related Story:
Does This Stock Rally Have Legs? January Barometer Will Be Key

