

Trend following is a strategy that has been used by traders for decades. Bull markets, bear markets, inflation or deflation–trend following has proven itself. Trend following can be used on stocks, forex or commodities as well as on any time frame.
Trend following with a plan tells you exactly:
- What to buy
- How much to buy
- When to exit with a profit or a loss
In order to succeed in trading you need an exact plan, risk management and proper trading psychology. Miss one of these attributes your chances of success are lessened.
First, I identify the strongest markets and the weakest markets. This is done by ranking the markets via relative strength or rate of change. Relative strength or rate of change can be found on most trading platforms. This defines the universe in which I am looking for trades. The concept of trend following is based on strong markets to continue and weak markets to continue to weaken.
The next step is to look for a break out trade or break down trade if I can put on a low risk trade. Firstly the concept of a break out trade is based on Richard Donchian who was a trend follower from the 1940s till his death almost 50 years later. The breakout trade was enhanced by the concept of the so-called “Turtle Traders.” It is very simple. Buy the 20 bar high and sell the 10 bar low (You can use any variation of this).
RISK PARAMETERS
However, I will only look to take a break out trade if I can put on a low risk bet. A low risk bet is risking no more than 1% of my account size. For example I have a $100,000 account size I do not want to risk more than $1,000 dollars. In order to determine this 1% risk I measure the distance from the X bar high to the Y bar low. For example if the distance from the X bar high to the Y bar low is 5, I have a $100,000 account size and determine I want to risk 1% I can trade 200 shares.
I have a bias to the long side as those trades can continue without limit, and shorts are limited. As I mentioned earlier, risk management is one of the principles that will keep you in the marathon of trading. In order to survive long term, I also limit my total allocation per sector as well as I limit my total risk on my open trade equity. I always want to trade with the trend. I look at moving average convergence divergence (MACD) and look to go long when it is above the zero line and increasing and vice versa for shorts.
SET-UP
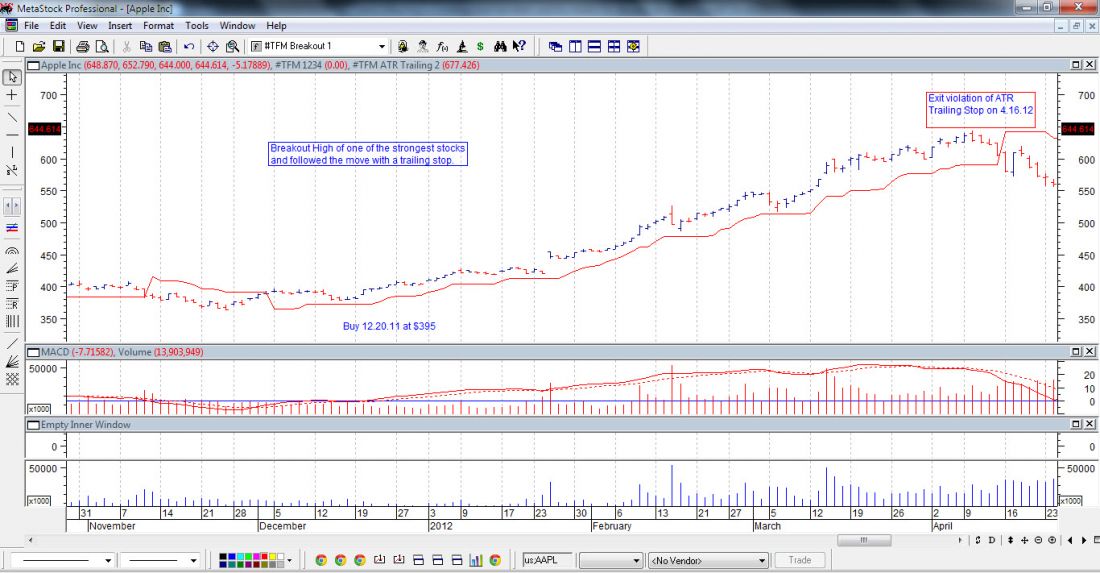
Exemplifying the above is an example of Apple at the end of 2011. Apple on a relative strength basis was one of the strongest stocks. See Figure 1.
GETTING IN
On Dec. 20, 2011 there was a breakout signal at $395 which was a 20 day high. The initial risk was to the 10 day low. You should not risk more than 1% of your account size on any trade. In order to determine how many shares take the difference between the 20 day high and 10 day low and divide it by 1% of your account size to determine.
GETTING OUT
Once the trade started working you would have followed the trade with patience and discipline until you received a signal to exit by a violation of a trailing average true range (ATR) stop. On April 16, 2011 Apple violated the ATR trailing stop and you would have exited.
Trading in this methodology is robust and an extremely powerful approach to extracting profits out of trending markets.
= = =
Related Feature Story:

