

Each of the ETFs discussed below have been in long-term trends, either up or down, and are now close to, or have already started to show signs of trend reversal.
Market Vectors Coal ETF (KOL)
The Market Vectors Coal ETF (KOL) may be close to triggering an upside breakout of a potential bottom consolidation pattern. Although not perfect, it could also be looked at as an inverse head and shoulders (H&S) pattern. Regardless, an upside breakout will provide a bullish signal and offers the first sign of a potential long-term trend reversal. The $26.33 price area is resistance of the consolidation pattern, and it has been tested as resistance about six times over the past four months.
KOL has been in a downtrend since hitting a peak of $51.87 in April 2011, and it was one of the worst performing ETFs in 2012. Support was found at $21.49 in September of last year, thereby completing a 58.6% fall off the 2011 peak.
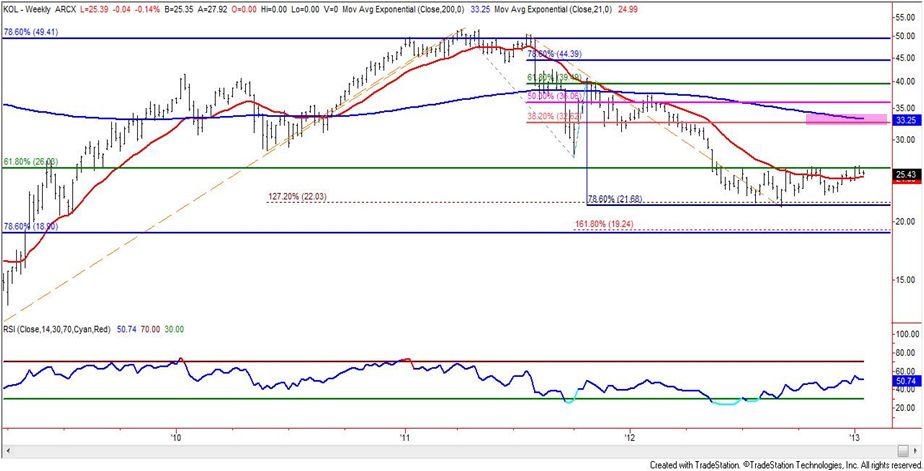
A breakout should see KOL move quickly back above its 200 exponential moving average (ema) on the daily chart (not shown), for the first time since August 2011. The daily 200ema is now at 26.55. Note that the breakout level and the 200ema are very close to converging, giving added significance to the breakout.
There are several price levels to watch on the upside. The first is the measuring objective of the bottom formation, which is at $31.17. This is followed by the 38.2% Fibonacci retracement level at $32.62, which is not far from the weekly 200ema, currently at $33.33. At a minimum a 38.2% retracement is likely to be reached once a clear upside breakout is indicated. The next levels to watch would be $36.06, followed by $39.49, consisting of the 50% retracement and 61.8% Fibonacci retracements, respectively.
The above bullish scenario starts to weaken on a move below $22.84, and fails below $21.49, the September 2012 low.
iShares Barclays 20+ Year Treasury Bond ETF
The iShares Barclays 20+ Year Treasury Bond ETF (TLT) has been in an uptrend for almost two years and has recently triggered a long-term bearish trend reversal.
Four weeks ago TLT broke below the neckline of a large bearish H&S topping pattern. The significance of the price area represented by the neckline (approximately $122.13) is increased as it was close to prior long-term resistance as well as support of the weekly 21ema. Resistance of the neckline and 21ema was subsequently tested over a two-week period which was followed by further declines, including a drop below the prior swing low at $118.05. That provided another bearish confirmation as it forms the price structure of the uptrend.
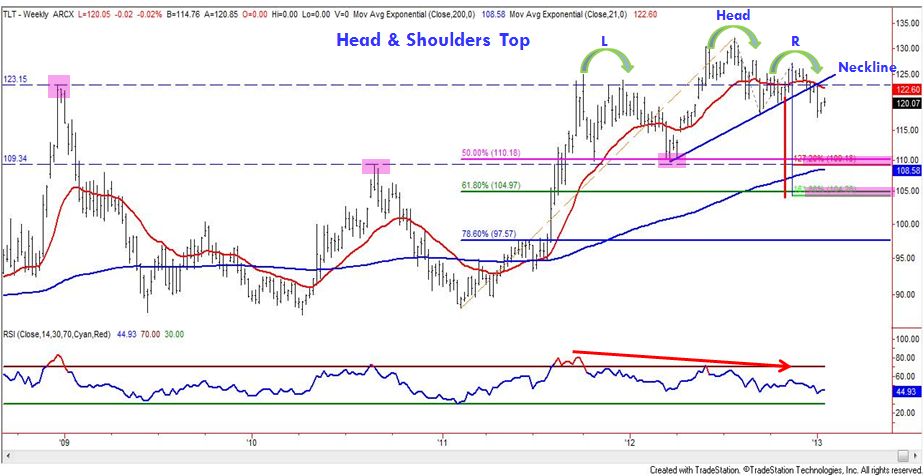
There are two downside target zones identified on the weekly chart; $110.18 to $109.34, and $105.61 to $104.28. The first target zone covers a price area where both resistance and support were clearly found in the past (prior peaks and troughs), and also includes two Fibonacci levels; the 50% Fibonacci retracement of the long-term uptrend and the 127.2% projection of the first leg down of the six-month downtrend. Also, potential support of the 200ema is close by this first zone, currently at $108.50.
The high of the second target zone, $105.61, is arrived at by calculating the measuring objective of the H&S top with $112.13 used as the breakout level. This second support zone also includes a 61.8% Fibonacci retracement level, along with a 161.8% projection of the downtrend now forming. Given the inclusion of the H&S objective in the second zone, along with the 61.8% retracement, it seems likely to be reached once TLT turns back down.
Watch the current bounce as TLT heads back up towards the neckline area for possible short entries. A rally to above the right shoulder, 127.19, would indicate a failure of the above bearish scenario, at least for now.
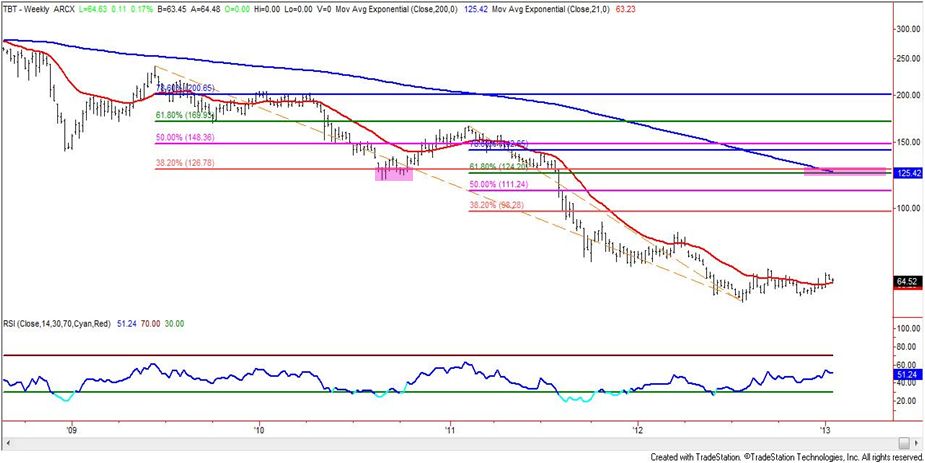
Another way to take advantage of a reversal in Treasuries is to use the reverse 2X leveraged ETF, ProShares UltraShort 20+ Year Treasury (TBT). Keep in mind this is a leveraged ETF and therefore tighter risk management may be warranted. A daily close above $69 signals strengthening.
Rydex Currency Shares Euro Trust ETF (FXE)
A little more than a month ago the Rydex Currency Shares Euro Trust ETF (FXE) broke out of a long-term bullish inverse H&S pattern. Subsequently, support of the neckline ($129.36 area) was tested over two consecutive weeks before FXE turned back up. This is classic bullish behavior following a breakout.
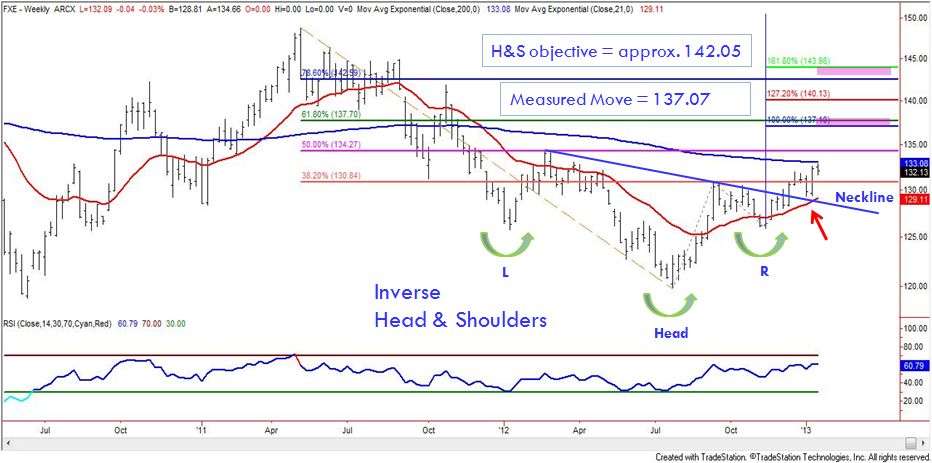
If FXE can rally up to the 50% retracement ($134.27) of the long-term downtrend it will also be back above its weekly 200ema, now at $133.08. Also supportive of a bullish trend continuation is that FXE has been above its daily 200ema since November 2012. A bullish crossover of the 21ema/200ema occurred on the daily chart shortly thereafter.
There are two areas of confluence that provide for higher targets. The first target zone is from approximately $137.10 to $137.70. It includes the target for a measured move, where the second leg up off the July 2012 bottom matches the first leg, and the 61.8% Fibonacci retracement of the full downtrend off the May 2011 peak, respectively.
A higher target consists of the measuring objective from the inverse H&S at $142.05, which essentially matches the 78.6% Fibonacci retracement price level that is at $142.59.
[Editor’s note: What ETFs are you trading now? Post a comment below to share or ask the author a question.]

