
Watch for lots of activity this week
A heavu schedule of economic reports this week is means volatility and wider price swings are likely — great for traders, but you have to be nimble.
S&P500 Cash Index week ending Jan. 25/13
SPX Weekly Chart
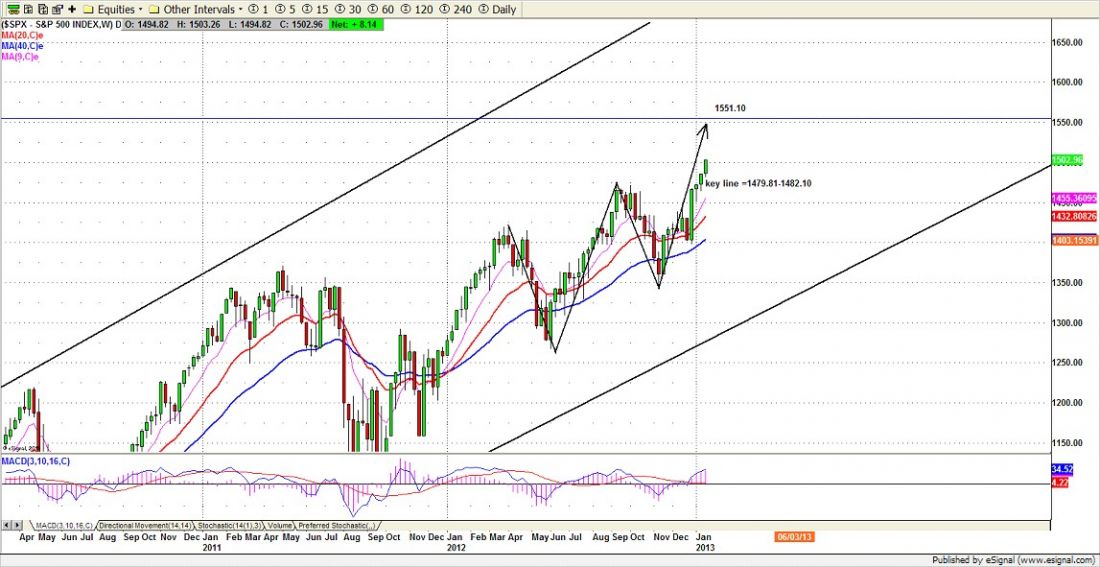
The S&P 500 cash index (SPX) closed at 1502.96 on Friday, up 16.98 points for net weekly gain about 1.14%.
The stock market had another positive week. Although Apple’s earning disappointed, both SPX and DOW made a multi-year high for the first time since 2007.
This week is full of economic reports, including the FOMC interest rate decision. It is also the week ending January and beginning of February. The volatility of price movement could increase this week.
Technical analysis
SP500 broke the psychology resistance level at 1500 last week and managed to close above it for first time since 2007. Even though that was a sign of confidence in the economic recovery, the market’s current overbought condition demands our attention. With uncertainty still lingering about U.S fiscal policy and the European economy, too much optimism may well lead us into another disaster.
Based on the weekly chart (above), the intermediate-term target at the 1550 level remains intact, as long as SPX continues to make its higher highs and higher lows in the coming days. The 1471-1475 breakout level becomes the current support zone and SPX may pullback to retest this level this week.
Based on wave principles, the long-term outlook for the upside target remains at the1590-1600 range, once the SP500 broke the 1474.51 level. But 1519.50-1530 could act as resistance this week due to the intermediate-term overbought situation.
Based on pattern moves, the Gartley pattern high 1511.24 lies ahead. It is possible to see SPX pause or stall under that level for several days. The symmetrical pattern high should still be around 1551.12. But to reach this level, SPX needs to deal with 1511.24 high first.
Last year the fourth quarter declining attracted many shorts. At the current levels, shorts covering are major fuel for the SPX rally. Until now, the SPX has only experienced a few minor pullbacks in this rally. The earlier shorts are looking for a way out and the sideline buyers are waiting for a better way in. Both could help SPX to repeat the move it made in the first quarter of 2012.
Monthly resistance 1500 and support 1405; Weekly resistance 1515 and support 1465
To see the complete analysis, including trading levels for S&P futures plus the weekly outlook for gold, oil, bonds and the Euro, visit www.naturus.com. Free registration required

