

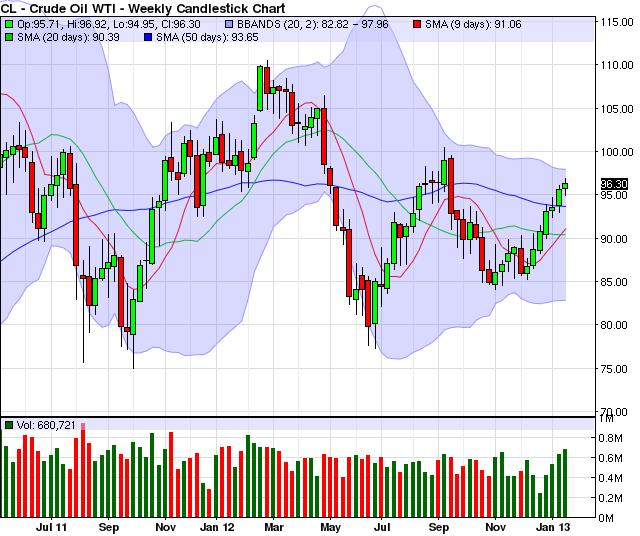
Looking at the weekly charts on Nymex crude oil, we are poised for the longest run of weekly gains since 2009.
SUPER TREND
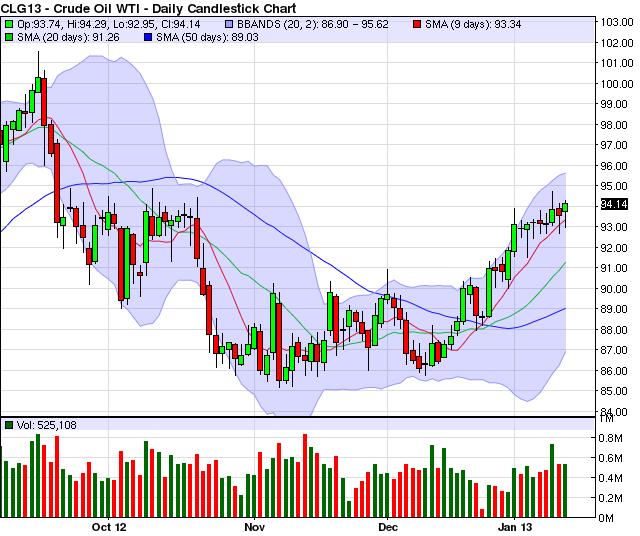
Technically, the market keeps moving up from the December low of $85.76 per barrel, since then we have formed what I refer to as a super-trend up. See Figure 1 below, a daily Nymex February crude oil chart. The market was recently trading about $94.23 per barrel.
The super-trend started when the 9-day simple moving average (SMA) seen in red, crossed over the 20-day SMA, seen in green. Both SMA’s started to point up and the price of crude oil stayed above the 9-day SMA which is now your first area of support.
WEEKLY CHART
Technically, I see the first step for a buy signal on the weekly chart as well. The 9-day SMA (red line) is starting to cross over the 20-day SMA (green line). If the cross occurs and both SMA’s start to point higher and the market stays above the 9-day we would have a buy signal in crude oil on two different time frames, according to my technical analysis. A buy signal on two different time frames would be very bullish with my style of trading options.
OPTIONS PLAYS
Some potential plays could be to buy bull call spreads and/or outright calls in Nymex crude oil, for traders who believe the uptrend will continue.
I like to recommend to my clients to trade with the trend instead of trying to pick a “top” or a “bottom,” but when buying calls or call spreads we also look to buy, in a 3 to 1 ratio, a put for protection in case the market makes a major move against us.
TRADING COMMODITY FUTURES AND OPTIONS INVOLVES SUBSTANTIAL RISK OF LOSS AND IS NOT SUITABLE FOR ALL INVESTORS. YOU SHOULD CAREFULLY CONSIDER WHETHER TRADING IS SUITABLE FOR YOU IN LIGHT OF YOUR CIRCUMSTANCES, KNOWLEDGE AND FINANCIAL RESOURCES. THESE RECOMMENDATIONS ARE A SOLICITATION FOR ENTERING INTO DERIVATIVES TRANSACTIONS.
THIS IS AN OPTIONS PLAY ARTICLE NOT DESIGNED FOR FUTURES. PLEASE DO NOT USE THIS ARTICLE AS A TRADE RECOMMENDATION TO TRADE FUTURES. FUTURES, OPTIONS AND FOREX TRADING IS SPECULATIVE IN NATURE AND INVOLVES SUBSTANTIAL RISK OF LOSS. ALL KNOWN NEWS AND EVENTS HAVE ALREADY BEEN FACTORED INTO THE PRICE OF THE UNDERLYING COMMODITIES DISCUSSED. THE LIMITED RISK CHARACTERISTIC OF OPTIONS REFERS TO LONG OPTIONS ONLY; AND REFERS TO THE AMOUNT OF THE LOSS, WHICH IS DEFINED AS PREMIUM PAID ON THE OPTION(S) PLUS COMMISSIONS.
FOR CUSTOMERS TRADING OPTIONS, THESE FUTURES CHARTS ARE PRESENTED FOR INFORMATIONAL PURPOSES ONLY. THEY ARE INTENDED TO SHOW HOW INVESTING IN OPTIONS CAN DEPEND ON THE UNDERLYING FUTURES PRICES; SPECIFICALLY, WHETHER OR NOT AN OPTION PURCHASER IS BUYING AN IN-THE-MONEY, AT-THE-MONEY, OR OUT-OF-THE-MONEY OPTION. FURTHERMORE, THE PURCHASER WILL BE ABLE TO DETERMINE WHETHER OR NOT TO EXERCISE HIS RIGHT ON AN OPTION DEPENDING ON HOW THE OPTION’S STRIKE PRICE COMPARES TO THE UNDERLYING FUTURE’S PRICE. THE FUTURES CHARTS ARE NOT INTENDED TO IMPLY THAT OPTION PRICES MOVE IN TANDEM WITH FUTURES PRICES. IN FACT, OPTION PRICES MAY ONLY MOVE A LITTLE.
THE LIMITED RISK CHARACTERISTIC OF OPTIONS REFERS TO LONG OPTIONS ONLY AND REFERS TO THE AMOUNT OF THE LOSS, WHICH IC DEFINED AS THE PREMIUM PAID ON THE OPTIN(S) PLUS COMMISSIONS.

