

The markets have been on a tear over the last few months and although at times it seems like this relentless bull market will never stop surging higher, yesterday’s bearish engulfing bar on the SP-500 reminds us that it’s not “if” but “when” a correction will come.
So let’s step aside from all the madness: take the pause that refreshes, and see where the market is likely to go in a correction, while still maintaining its overall up trend.
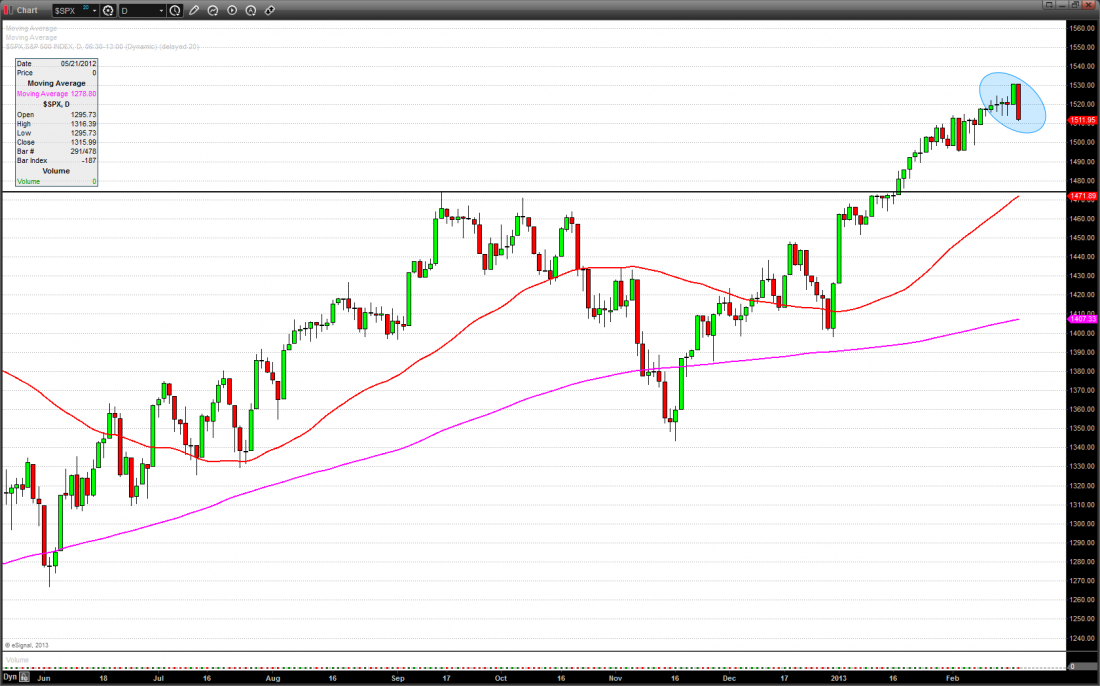
Yesterday’s bar was the ugliest since we broke out to new highs in mid-January. That breakout area around 1475 looks like to most obvious support/re-test level.
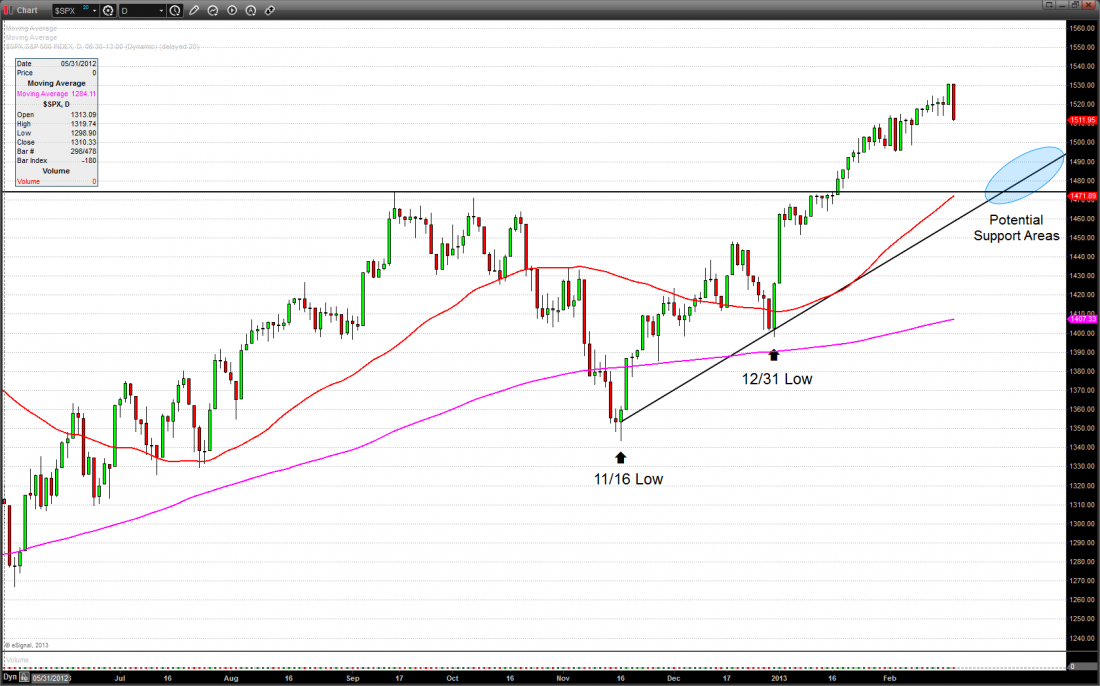
However, the key to where support comes is will have to do with how fast a correction takes place. A more rapid descent can take it back to 1475 support, but a slower, more orderly decent could take it higher up on the trend line that connect the 11/16 and 12/31 lows.
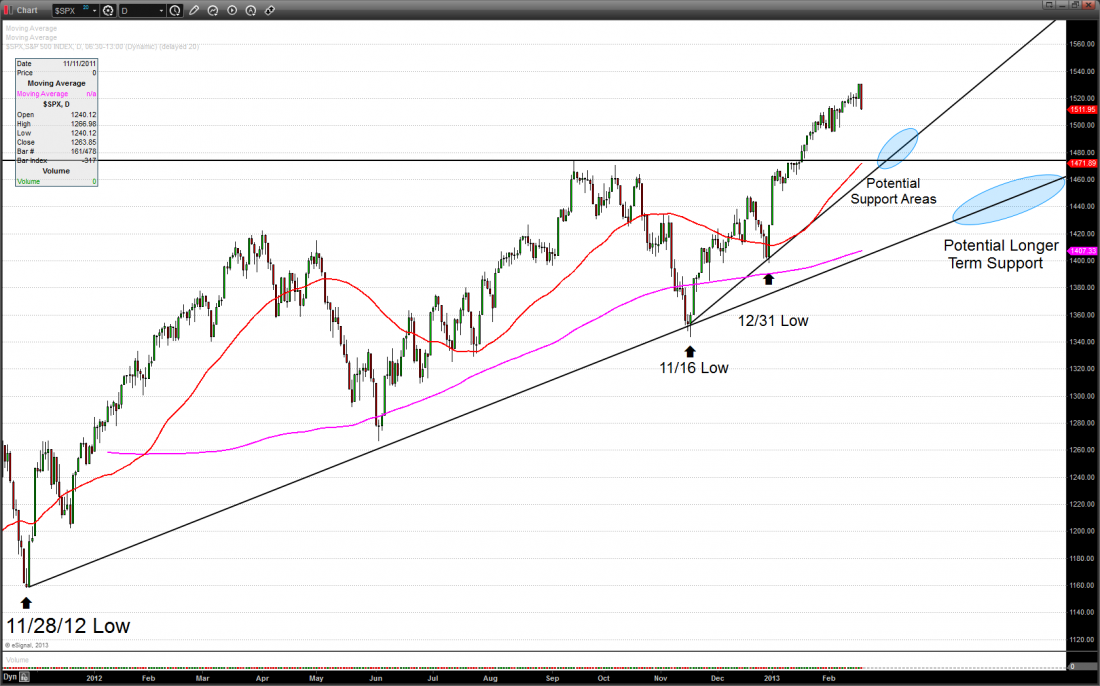
Finally, don’t count out the possibility that we could have an extended pullback that could take us to the longer term trendline connecting the 11/28/11 and 11/16/12 lows. Believe it or not, that pullback could take us down anywhere from forty-five to eighty-five handles and still keep us in an overall uptrend.
Remember, even if this is the beginning of a multi-year bull run (which I think it is), the market won’t go straight up. It will have peaks and valleys along the way, and pulling back a bit to see where it currently is, and where it is likely to go, will make your job as a trader and investor that much easier.

