
Small pullback, but more upside expected
The S&P 500 cash index (SPX) closed at 1515.60 on Friday, down 4.19 points for a small weekly loss of 0.02%.
Although SPX hit multi-year highs early in the week, it still couldn’t hold the gain. The latest Fed minutes, merger news and mixed economic data overloaded investors and doubt led to selling. At the end, SPX had a small losing week.
This week is the end of February. It is supposed to be a bullish period at the end of the month. But plenty of economic reports and a host of extraneous events can keep the market exciting.
Technical Analysis
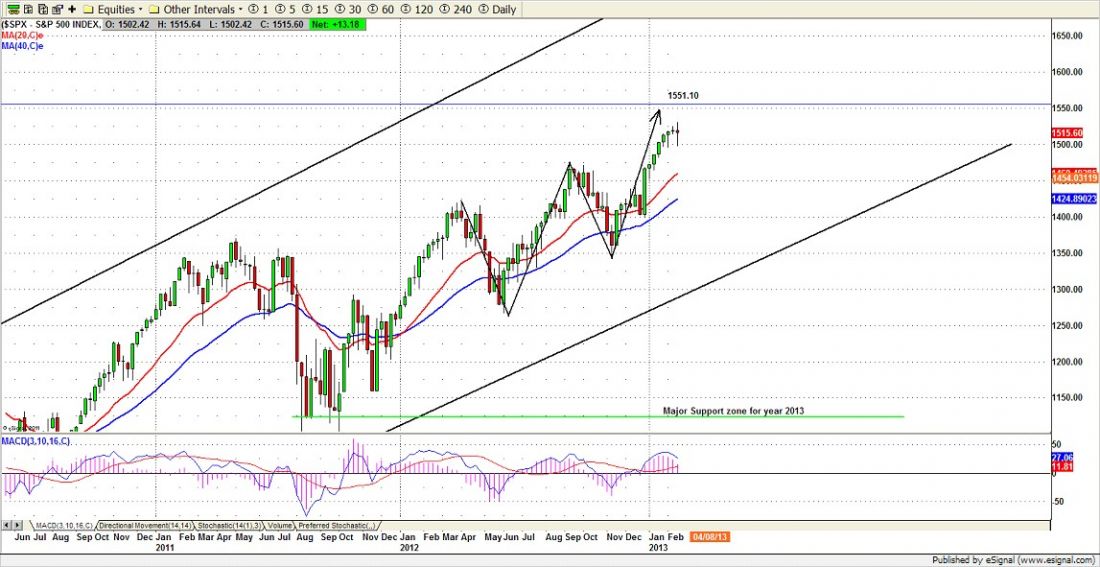
Last week, SPX showed a second indecision signal – a dpji – on the weekly chart. The momentum remains slow. The price stalled near 1515.50, which is a MMline resistance level, marking a TOP.
Based on the weekly chart (above), 1550 level is the ending target of the bullish butterfly pattern, and the current price is below it. So far the target remains intact as long as the weekly closing price is near the 1515.50 level.
SPX had two days of correction last week. If SPX continues going higher in the early days of this week, the price may develop along the same pattern as February or March of last year, a brief pullback followed by a rally. The price could rally ahead of the March 1 sequester and the (alleged) $85 billion in spending cuts or into the release of the government stress test of U.S. banks, then sell off again as we approach the March 20 FOMC meeting.
And this week, lots of hedge funds may be looking to protect their 2013 gains. Lots of puts have been purchased. Look for increased volatility this week.
Monthly resistance 1585 and support 1440; Weekly resistance 1550 and support 1485.
To see the full market analysis, including the outlook for S&P futures, and gold, oil, bond ETFs and EUR/USD, visit this link:
http://naturus.com/registered-users/weekly-market-preview.html
Free registration required.

