

The monthly employment numbers released the first Friday of every month are always closely watched, especially now since Bernanke and Co. have stated rates will be kept low until the unemployment rate drops to 6.5%.
But in my opinion, a lot of funny math is used to calculate the unemployment rate, and a better number to follow is the weekly jobless claims. In fact the 4-week moving average of the weekly number very closely matches the movement of the S&P 500.
Figure 1 below compares the S&P 500 (blue) and the initial jobless claims (red) (note the red line has been flipped upside down so we can get a better visual). The conclusion is simple and obvious. When initial jobless claims drop, the market moves up. The relationship is not perfect, but it’s close enough to warrant paying attention to the weekly number.
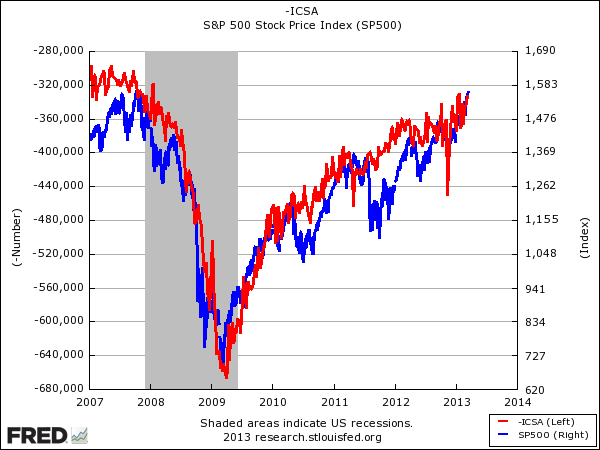
Figure 1 source: FRED – Federal Reserve Economic Data
The last five jobless claims numbers are: 366,000, 347,000, 342,000, 332,000, 336,000 (today’s number). The 4-week MA dropped to 339,750 – the lowest level since February 2008. Nice trend.
= = =
Read Leavitt’s feature story here:

