Many traders have been disheartened by recent moves in gold futures and SPDR Gold Shares ETF (GLD). Previous market action has always advised us to hedge money printing with long positions in this commodity. Unfortunately, this rule of thumb has not really worked this past year and half as the price of the yellow metal keeps getting smashed. This is going to change now.
Trading Opportunity
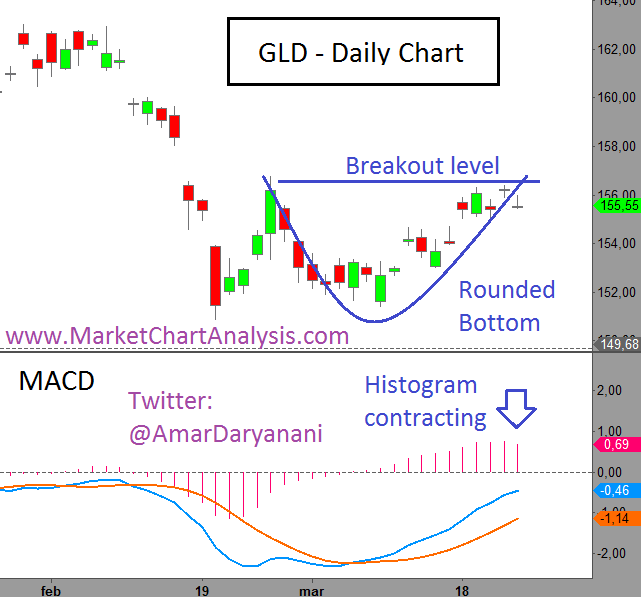
This first GLD daily chart shows us a bull pattern of a “rounded bottom” with a possible breakout level at $156.85. Should there be good volume on the upswing one could consider the rally to be real.
MACD signal cross in the first week of March has given some fuel to the current boost of GLD. However, the histogram of this indicator has started to contract; hence one should wait for a minor pullback before pulling the trigger.
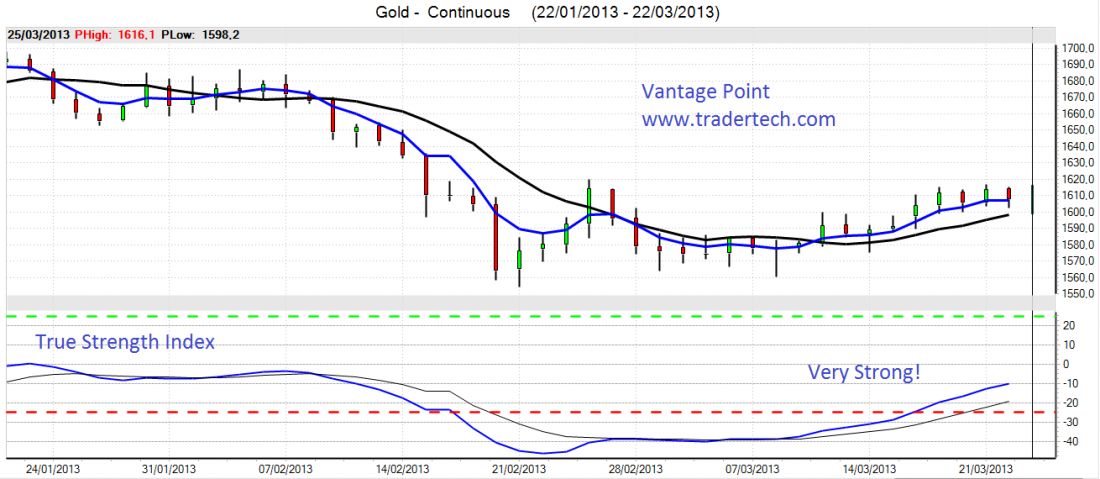
The VantagePoint chart of gold futures is very promising. One of the most powerful indicators of this Charting software is the “True Strength Index” (TSI) and although a small correction could be in order, the fact is that gold futures have an underlying power that will not be stopped by money policy regulators this time.