

Sentiment isn’t typically used so much for timing the equity market as for gauging the overall mood of the market.
SIMPLE RULES OF THUMB
When the mood of market participants is too bearish, we know to start using other methods if we want to time the bottom of the market. If sentiment is too bullish, we start looking for a top.
Sentiment is a popular and widely-used indicator in technical analysis. There are many such sentiment polls available and they are typically constructed using self-selected polling. In a statistician’s world, this is a disqualifier as these people will skew the ‘mean’ or average.
But in a technician’s world, where we want to find how heavy the “ship” is leaning to one side or the other, and not where the middle of the ship currently lies, these sorts of polls can tell us exactly what we want to know.
AAII SENTIMENT SURVEY
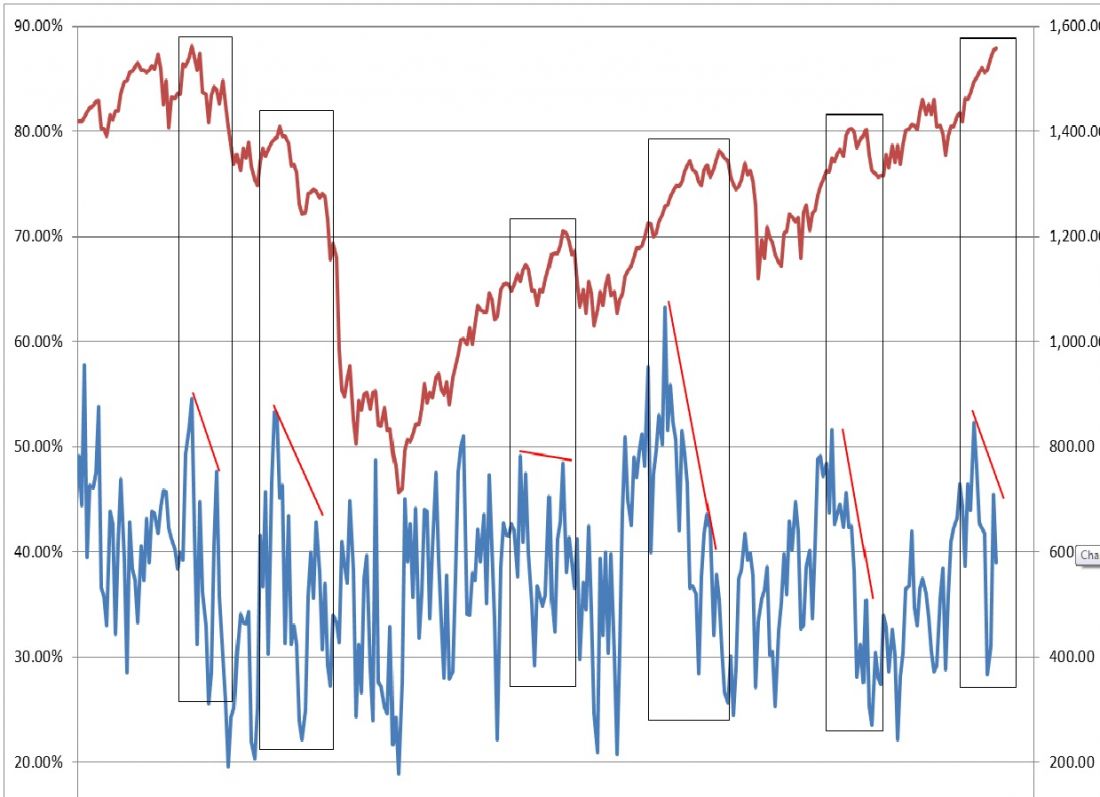
One such indicator is published by the American Association of Individual Investors (AAII). The recent low in the S&P 500 (red line on chart) on February 28 matched the low that week in the AAII bullish % sentiment index as it dipped below 30%. A quick glance at the indicator (blue line) and one can see that not all dips below 30% are correlated with tradable lows in equities.
BOTTOM LINE
But back away and take a look at the bigger picture. A move by bullish % from above (or near) 50% to below 30%, and then back to a high which is lower than the original high has been correlated with important equity tops in the past.
The indicator gave just such a signal last week.
[Editor’s note: Request a free copy of the March Lindsay Report here.]

